|
目录
一、第一题
二、第二题
三、第三题
四、第四题
五、第五题
六、第六题
七、第七题
八、 第八题
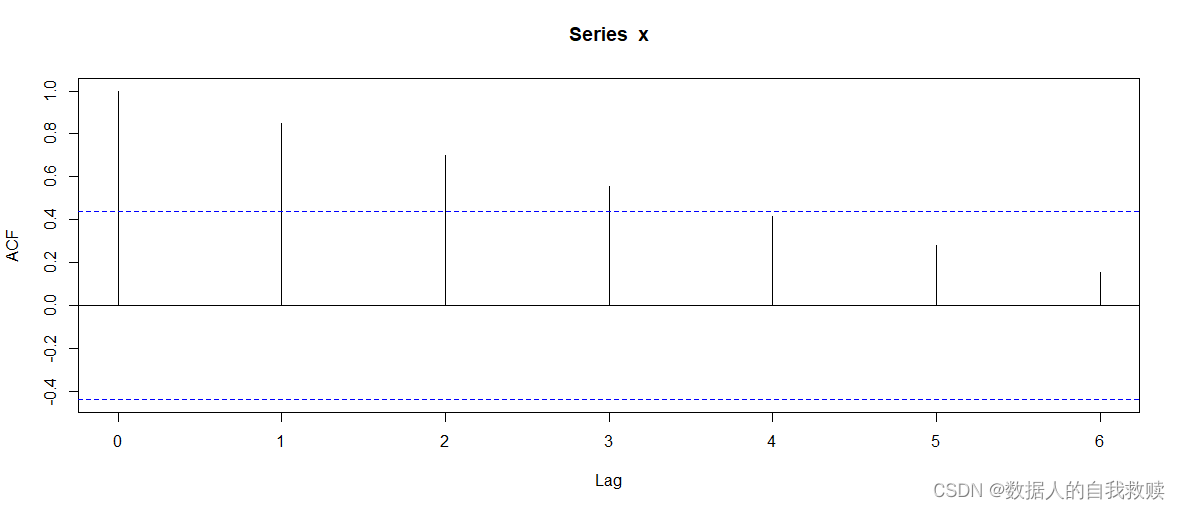
一、第一题
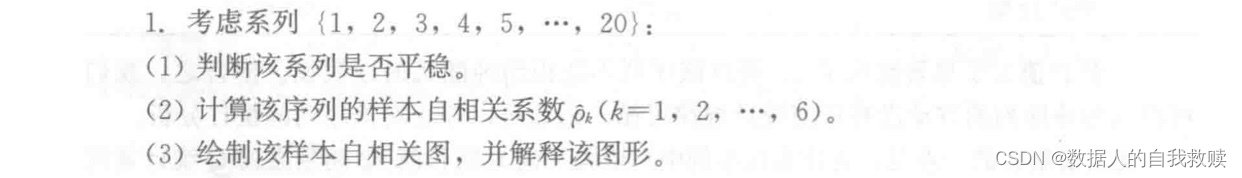
(1)非平稳,具有递增趋势(2)如下代码(3)序列自相关系数递减到0的速度比较缓慢,而且在较长延展期内自相关系数一直为正,之后又一直为负。在自相关图上显示出倒三角,这是具有单调趋势的非平稳序列的一种典型的自相关图形式。
> x=c(1:20)
> my_acf=acf(x,6)
> my_acf
Autocorrelations of series ‘x’, by lag
0 1 2 3 4 5 6
1.000 0.850 0.702 0.556 0.415 0.280 0.153
> acf(x)
 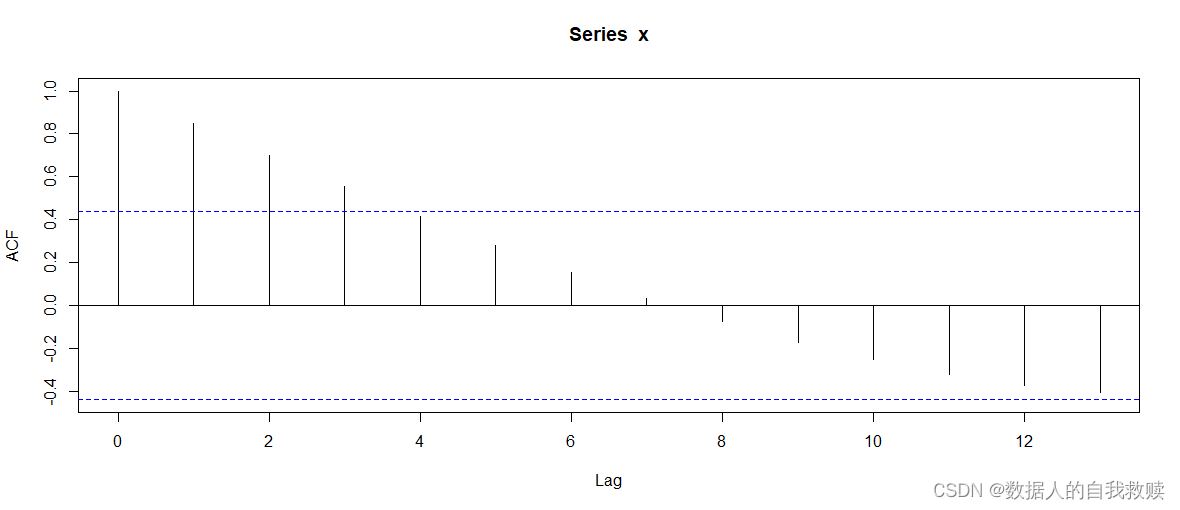 二、第二题
二、第二题

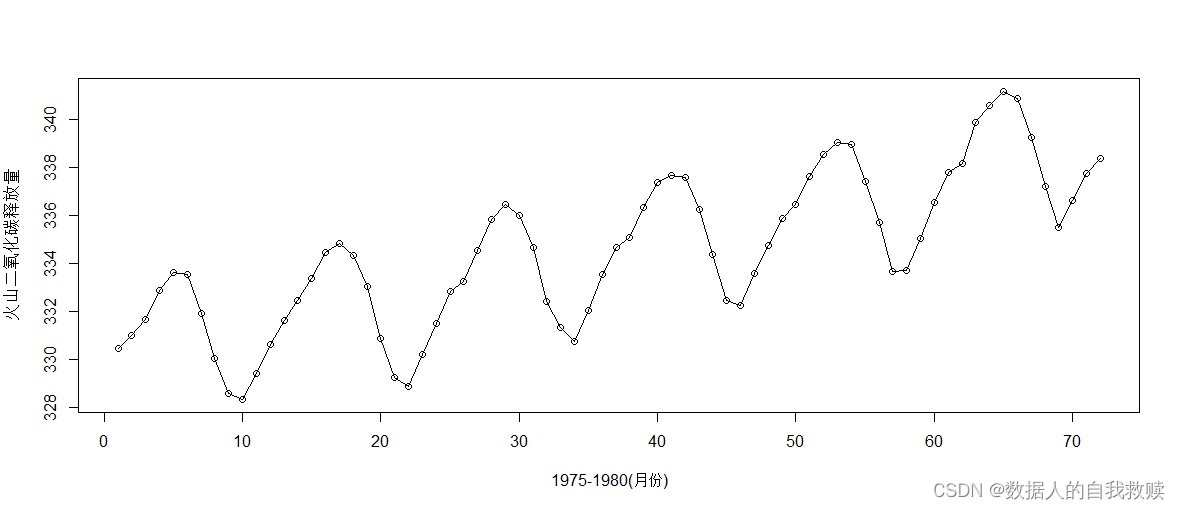
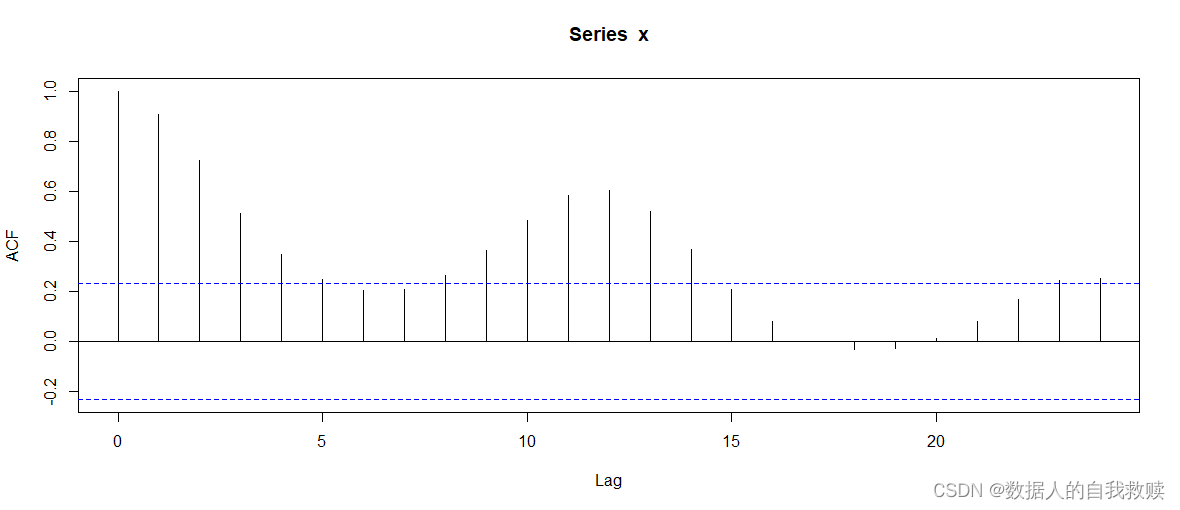
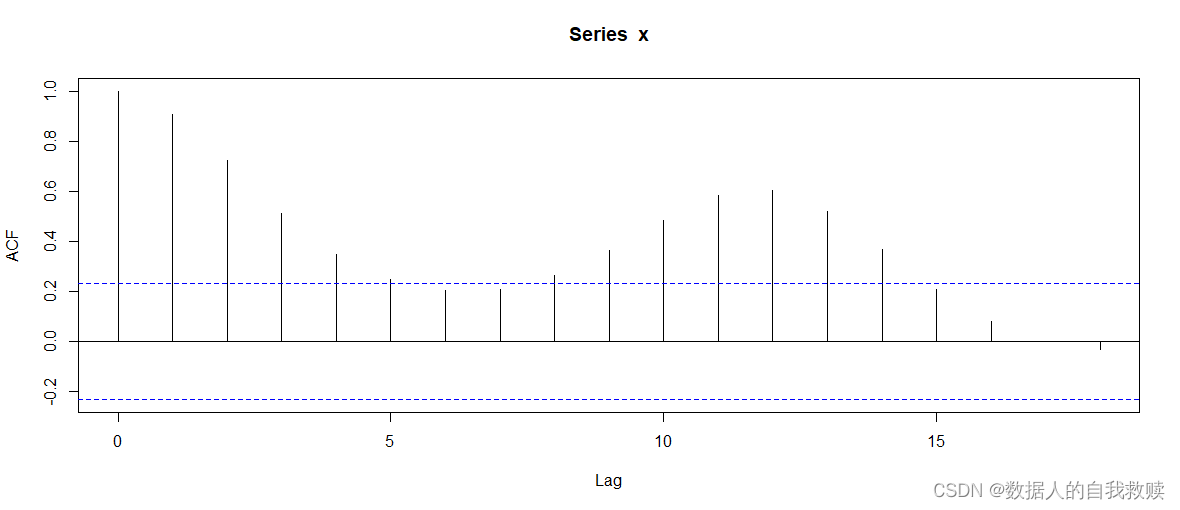
(1)非平稳(2)如代码所示(3)自相关图没有很快的趋于0,并且时而递减时而递增,非平稳
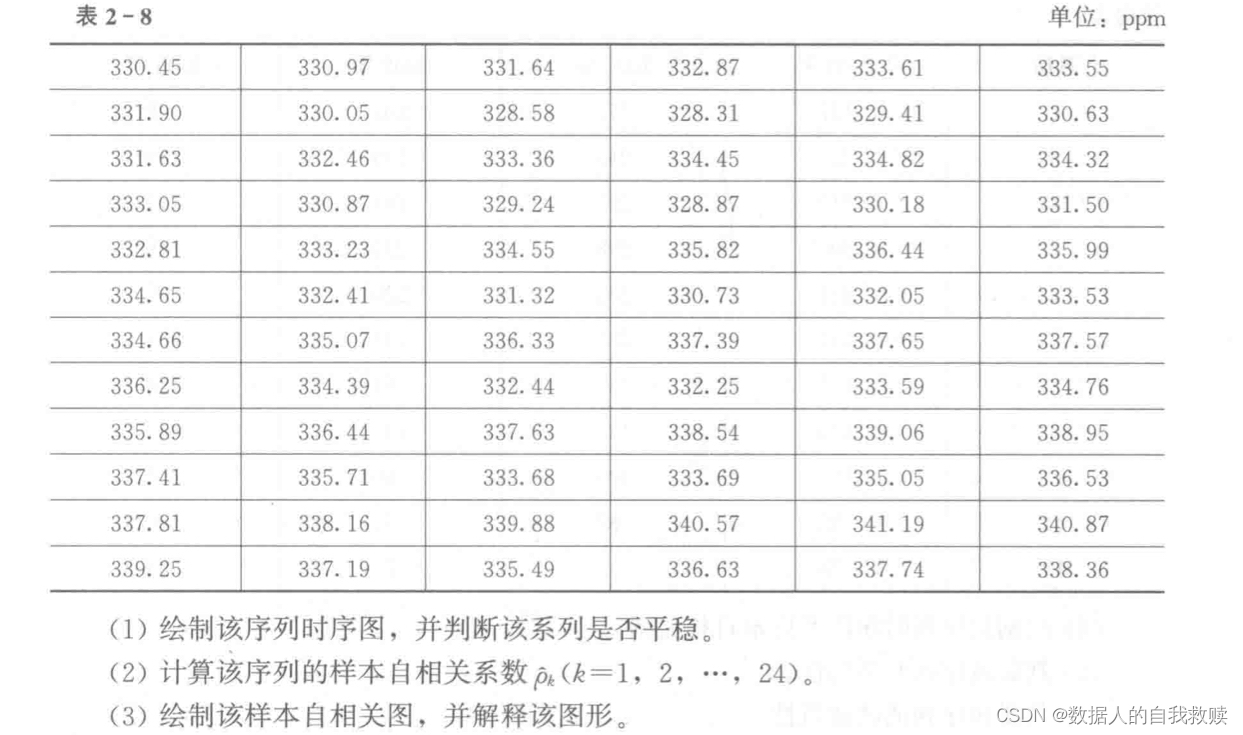
>x=c(330.45,330.97,331.64,332.87,333.61,333.55,331.90,330.05,328.58,328.31,329.41,330.63,331.63,332.46,333.36,334.45,334.82,334.32,333.05,330.87,329.24,328.87,330.18 ,331.50,332.81 ,333.23 ,334.55 ,335.82 ,336.44 ,335.99,334.65 ,332.41 ,331.32 ,330.73 ,332.05 ,333.53,334.66 ,335.07 ,336.33 ,337.39 ,337.65 ,337.57,336.25 ,334.39 ,332.44 ,332.25 ,333.59 ,334.76,335.89 ,336.44 ,337.63 ,338.54 ,339.06 ,338.95,337.41 ,335.71 ,333.68 ,333.69 ,335.05 ,336.53,337.81 ,338.16 ,339.88 ,340.57 ,341.19 ,340.87,339.25 ,337.19 ,335.49 ,336.63 ,337.74 ,338.36)
>plot(x,type="o",xlab="1975-1980(月份)",ylab="火山二氧化碳释放量",col=1)
>a=acf(x,24)
>a
Autocorrelations of series ‘x’, by lag
0 1 2 3 4 5 6 7 8 9 10 11
1.000 0.908 0.722 0.513 0.350 0.247 0.203 0.210 0.264 0.364 0.485 0.585
12 13 14 15 16 17 18 19 20 21 22 23
0.602 0.518 0.369 0.207 0.081 0.001 -0.032 -0.027 0.011 0.083 0.170 0.243
24
0.253
>acf(x)
三、第三题
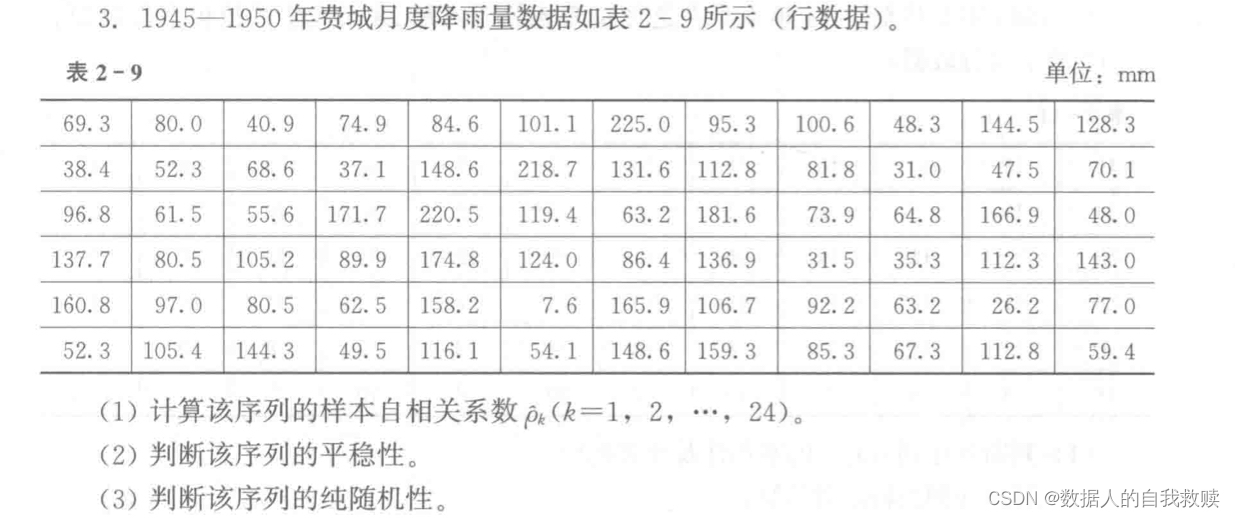
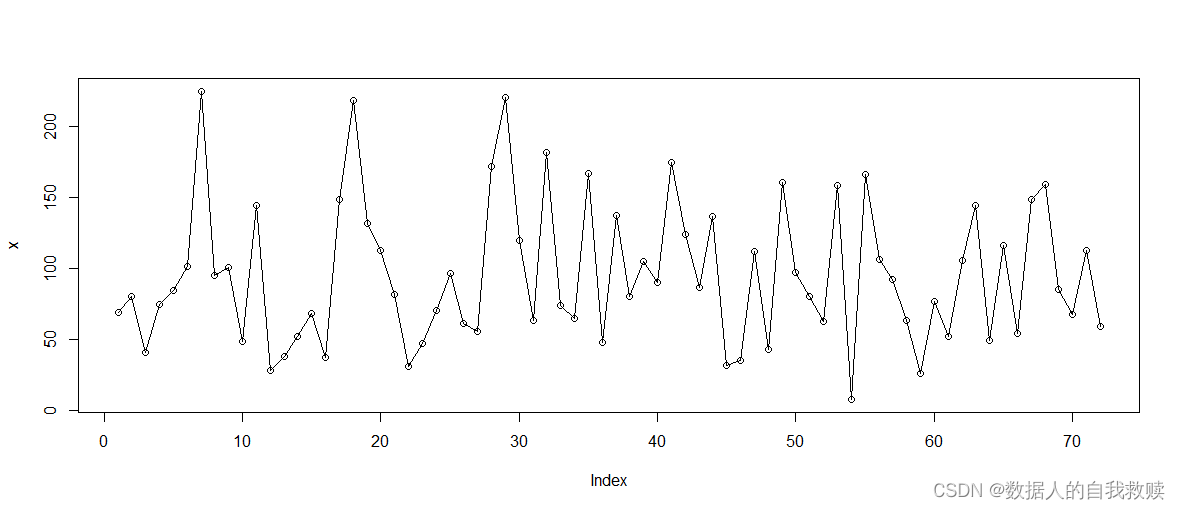
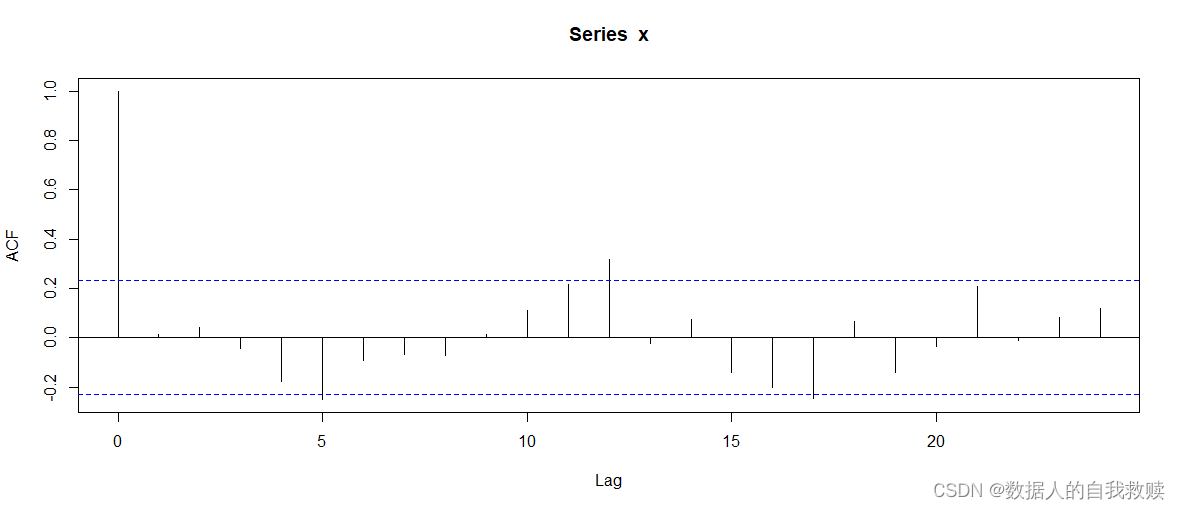
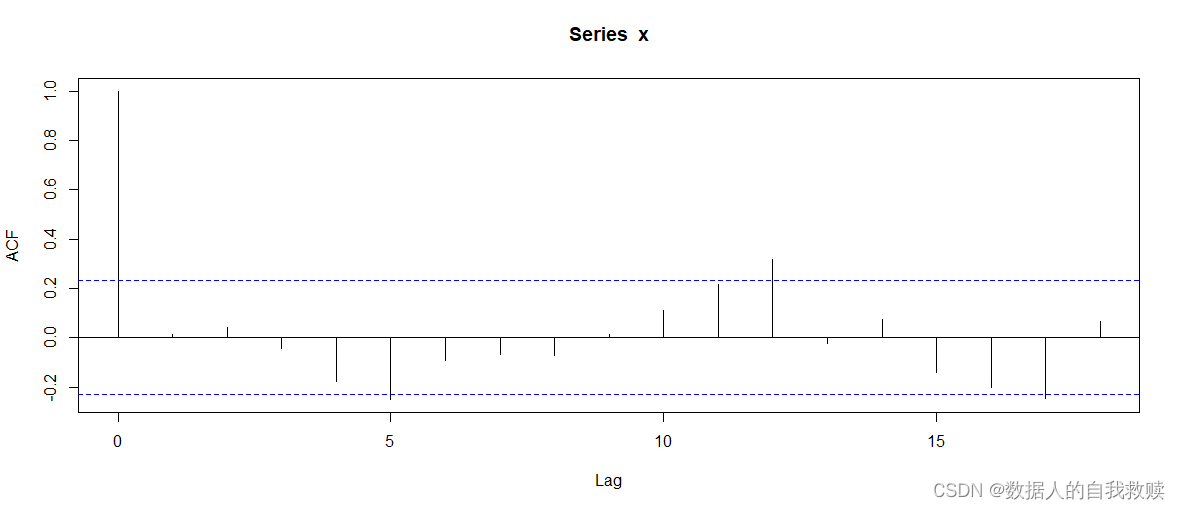
(1)如代码所示(2)是平稳序列:时序图没有明显趋势和周期,围绕100上下波动;自相关图在第二期接近于0(3)由检验知,不能拒绝纯随机性的原假设
> x=c(69.3 ,80.0 ,40.9 ,74.9 ,84.6 ,101.1 ,225.0 ,95.3 ,100.6 ,48.3 ,144.5 ,28.3,38.4 ,52.3 ,68.6 ,37.1 ,148.6 ,218.7 ,131.6 ,112.8 ,81.8 ,31.0 ,47.5 ,70.1,96.8 ,61.5 ,55.6 ,171.7 ,220.5 ,119.4 ,63.2 ,181.6 ,73.9 ,64.8 ,166.9 ,48.0,137.7 ,80.5 ,105.2 ,89.9 ,174.8 ,124.0 ,86.4 ,136.9 ,31.5 ,35.3 ,112.3 ,43.0,160.8 ,97.0 ,80.5 ,62.5 ,158.2 ,7.6 ,165.9 ,106.7 ,92.2 ,63.2 ,26.2 ,77.0,52.3 ,105.4 ,144.3 ,49.5 ,116.1 ,54.1 ,148.6 ,159.3 ,85.3 ,67.3 ,112.8 ,59.4)
> plot(x,type="o",col=1)
> a=acf(x,24)
> a
Autocorrelations of series ‘x’, by lag
0 1 2 3 4 5 6 7 8 9 10 11 12 13
1.000 0.013 0.042 -0.043 -0.179 -0.251 -0.094 -0.068 -0.072 0.014 0.109 0.217 0.316 -0.025
14 15 16 17 18 19 20 21 22 23 24
0.075 -0.141 -0.204 -0.245 0.066 -0.139 -0.034 0.206 -0.010 0.080 0.118
> acf(x)
> Box.test(x,lag=6,type="Ljung-Box")
Box-Ljung test
data: x
X-squared = 8.5225, df = 6, p-value = 0.2023
四、第四题

看样子是随机序列了
五、第五题
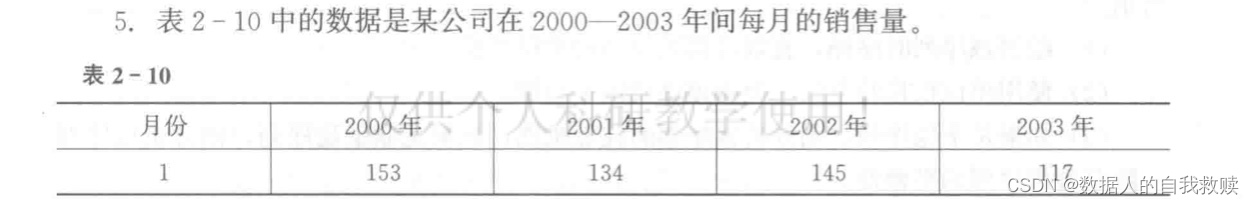
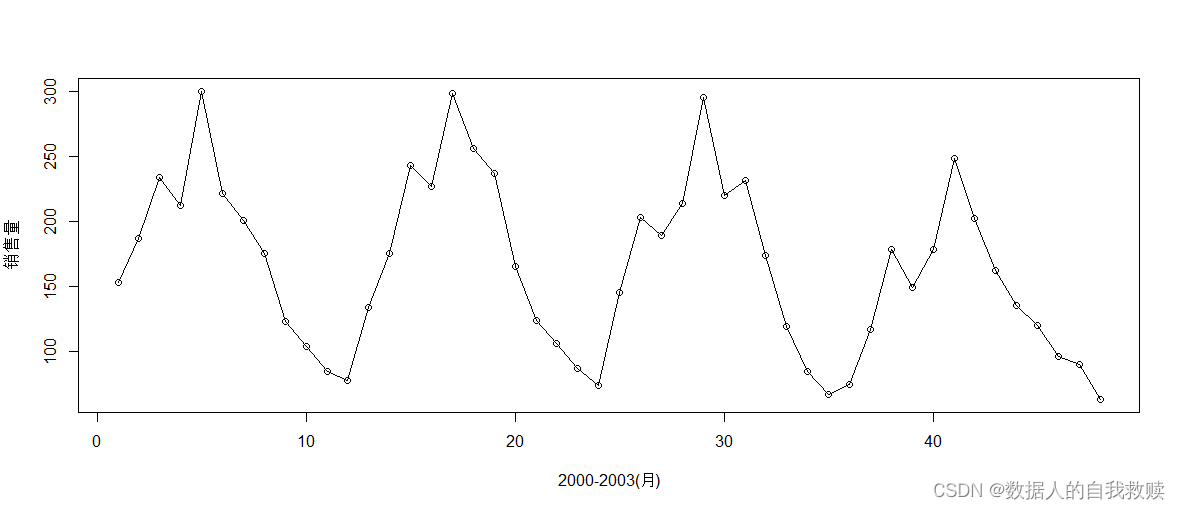
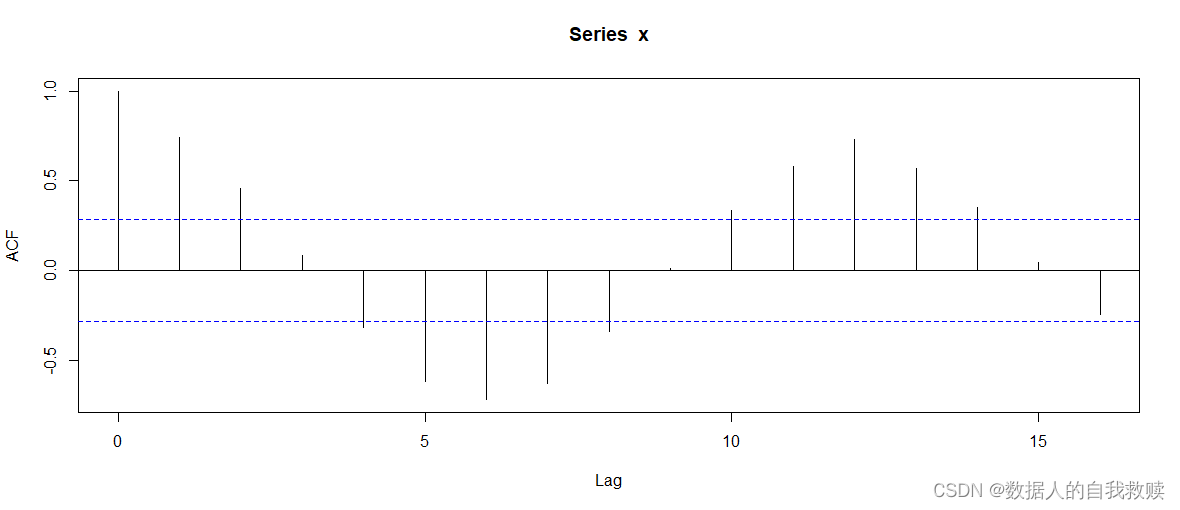
(1)见下图(2)非平稳:周期性波动(3)由检验知:非随机序列
> x=c(153 ,187 ,234 ,212 ,300 ,221 ,201 ,175 ,123 ,104 ,85 ,78,134 ,175 ,243 ,227 ,298 ,256 ,237 ,165 ,124 ,106 ,87 ,74,145 ,203 ,189 ,214 ,295 ,220 ,231 ,174 ,119 ,85 ,67 ,75,117 ,178 ,149 ,178 ,248 ,202 ,162 ,135 ,120 ,96 ,90 ,63)
> plot(x,type = "o",xlab="2000-2003(月)",ylab="销售量",col=1)
> acf(x)
> Box.test(x,lag=6,type="Ljung-Box")
Box-Ljung test
data: x
X-squared = 95.837, df = 6, p-value < 2.2e-16
> Box.test(x,lag=12,type="Ljung-Box")
Box-Ljung test
data: x
X-squared = 190.4, df = 12, p-value < 2.2e-16
六、第六题

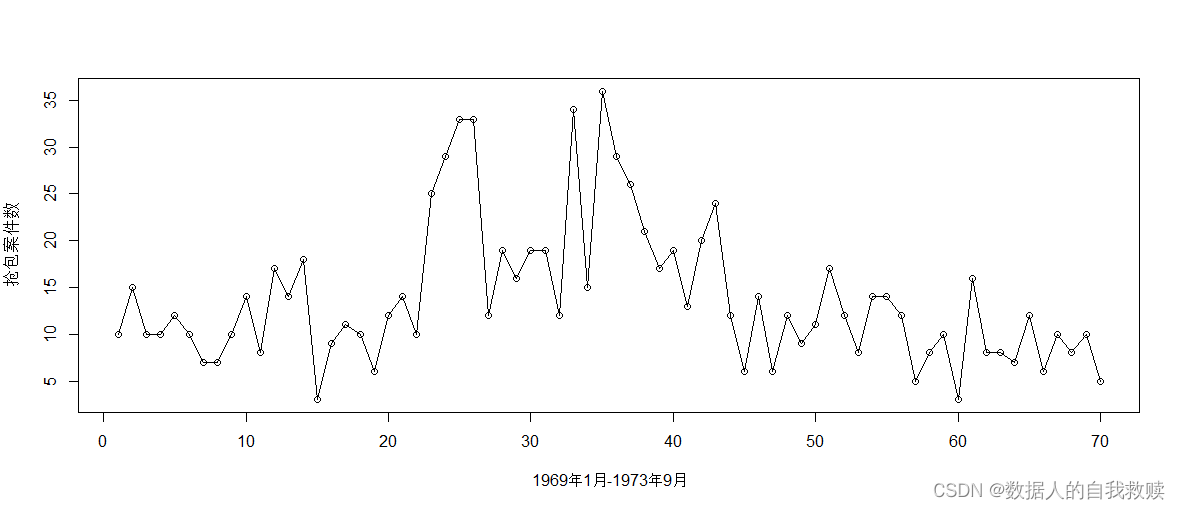
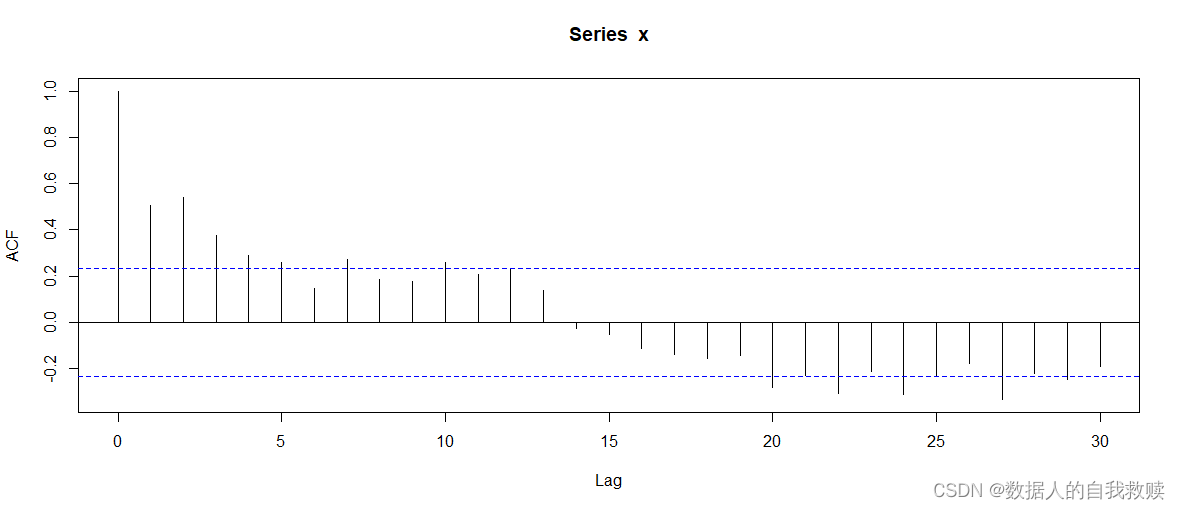
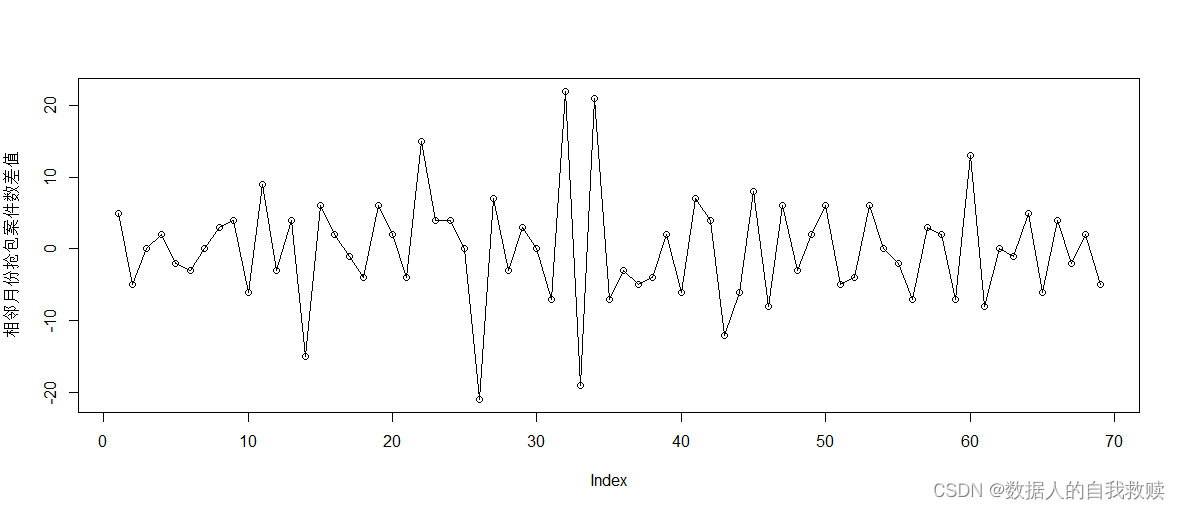
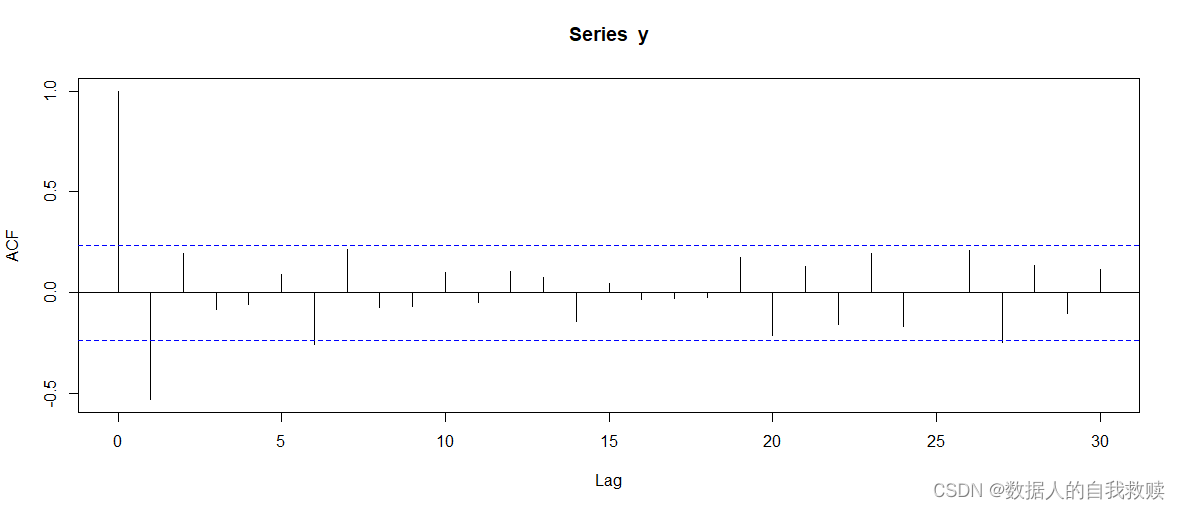
(1)非平稳;非随机(2)平稳;非随机
> x=c(10 ,15 ,10 ,10 ,12 ,10 ,7 ,7 ,10 ,14 ,8 ,17,14 ,18 ,3 ,9 ,11 ,10 ,6 ,12 ,14 ,10 ,25 ,29,33 ,33 ,12 ,19 ,16 ,19 ,19 ,12 ,34 ,15 ,36 ,29,26 ,21 ,17 ,19 ,13 ,20 ,24 ,12 ,6 ,14 ,6 ,12,9 ,11 ,17 ,12 ,8 ,14 ,14 ,12 ,5 ,8 ,10 ,3,16 ,8 ,8 ,7 ,12 ,6 ,10 ,8 ,10 ,5)
> plot(x,type = "o",xlab="1969年1月-1973年9月",ylab="抢包案件数",col=1)
> acf(x,30)
> Box.test(x,lag=6,type="Ljung-Box")
Box-Ljung test
data: x
X-squared = 64.016, df = 6, p-value = 6.85e-12
> Box.test(x,lag=12,type="Ljung-Box")
Box-Ljung test
data: x
X-squared = 88.975, df = 12, p-value = 7.794e-14
> y=diff(x)
> plot(y,type = "o",ylab="相邻月份抢包案件数差值",col=1)
> acf(y,30)
> Box.test(y,lag=6,type="Ljung-Box")
Box-Ljung test
data: y
X-squared = 29.458, df = 6, p-value = 4.982e-05
> Box.test(y,lag=12,type="Ljung-Box")
Box-Ljung test
data: y
X-squared = 35.943, df = 12, p-value = 0.0003308
  七、第七题 七、第七题

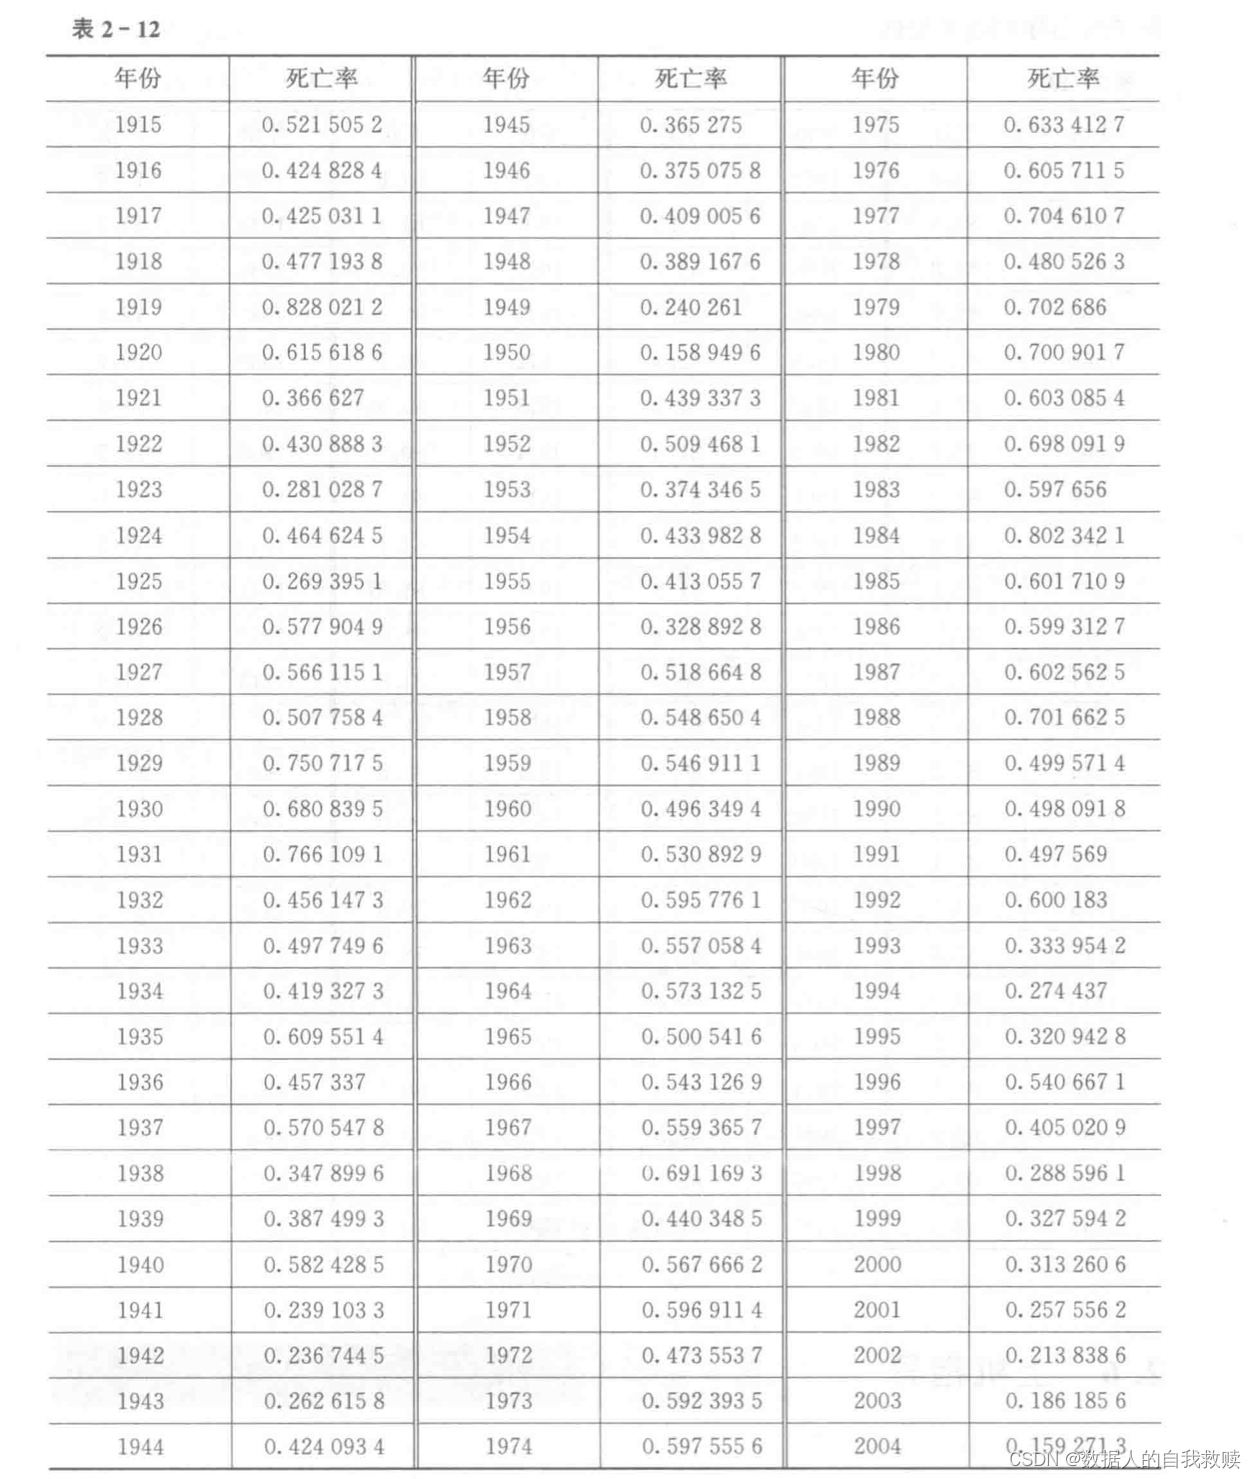
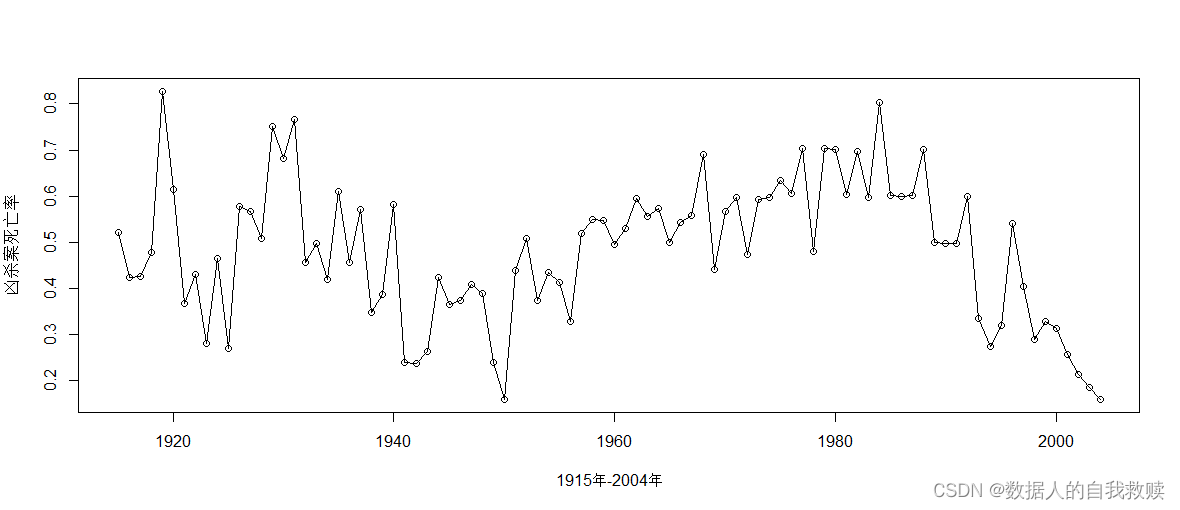
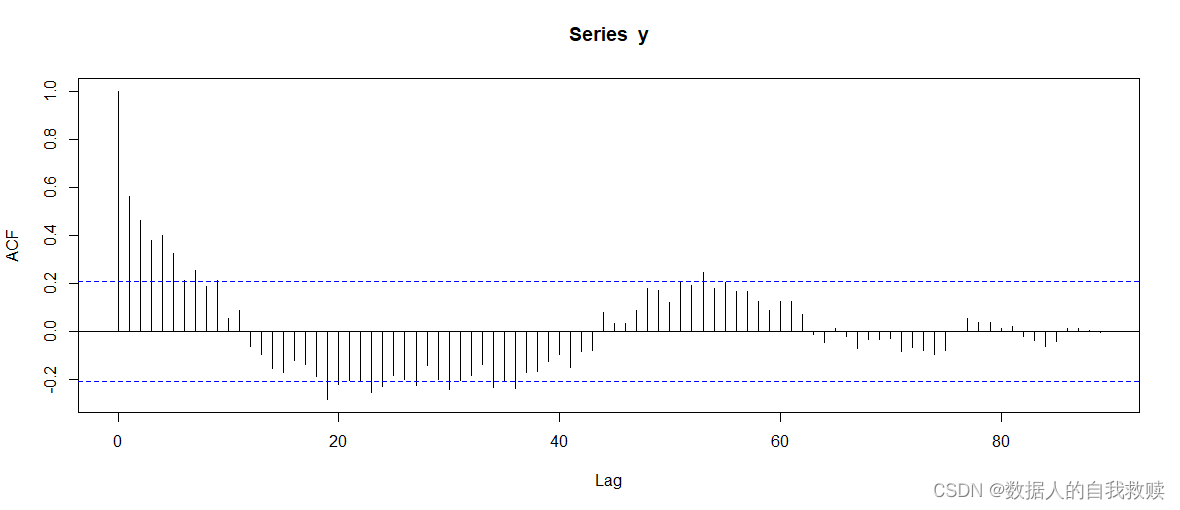
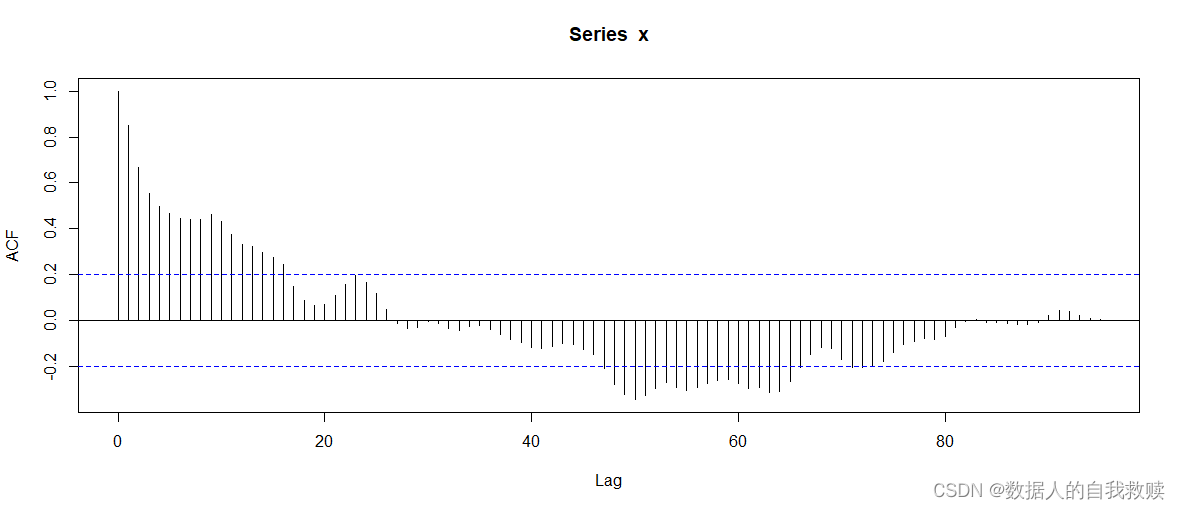
(1)直观平稳?(2)略(3)非平稳(由ACF图),一阶差分后平稳
> y=c(0.5215052 ,0.4248284 ,0.4250311 ,0.4771938 ,0.8280212 ,0.6156186 ,0.366627 ,0.4308883 ,0.2810287 ,0.4646245 ,0.2693951 ,0.5779049 ,0.5661151 ,0.5077584 ,0.7507175 ,0.6808395 ,0.7661091 ,0.4561473 ,0.4977496 ,0.4193273 ,0.6095514 ,0.457337 ,0.5705478 ,0.3478996 ,0.3874993 ,0.5824285 ,0.2391033 ,0.2367445 ,0.2626158 ,0.4240934 ,0.365275 ,0.3750758 ,0.4090056 ,0.3891676 ,0.240261 ,0.1589496 ,0.4393373 ,0.5094681 ,0.3743465 ,0.4339828 ,0.4130557 ,0.3288928 ,0.5186648 ,0.5486504 ,0.5469111 ,0.4963494 ,0.5308929 ,0.5957761 ,0.5570584 ,0.5731325 ,0.5005416 ,0.5431269 ,0.5593657 ,0.6911693 ,0.4403485 ,0.5676662 ,0.5969114 ,0.4735537 ,0.5923935 ,0.5975556 ,0.6334127 ,0.6057115 ,0.7046107 ,0.4805263 ,0.702686 ,0.7009017 ,0.6030854 ,0.6980919 ,0.597656 ,0.8023421 ,0.6017109 ,0.5993127 ,0.6025625 ,0.7016625 ,0.4995714 ,0.4980918 ,0.497569 ,0.600183 ,0.3339542 ,0.274437 ,0.3209428 ,0.5406671 ,0.4050209 ,0.2885961 ,0.3275942 ,0.3132606 ,0.2575562 ,0.2138386 ,0.1861856 ,0.1592713)
> x=c(1915:2004)
> plot(x,y,type = "o",xlab="1915年-2004年",ylab="凶杀案死亡率",col=1)
> acf(y,500)
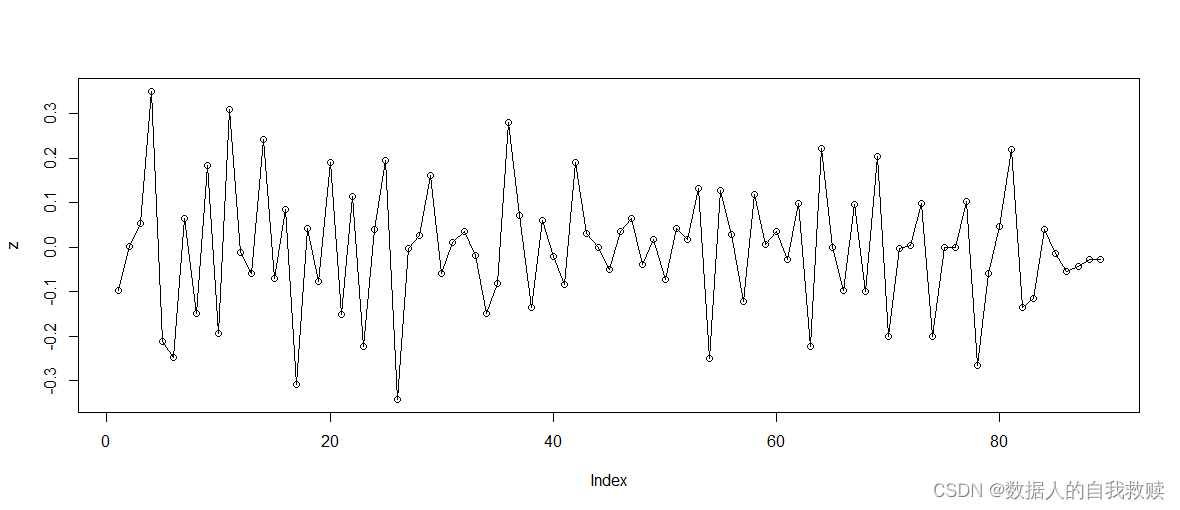
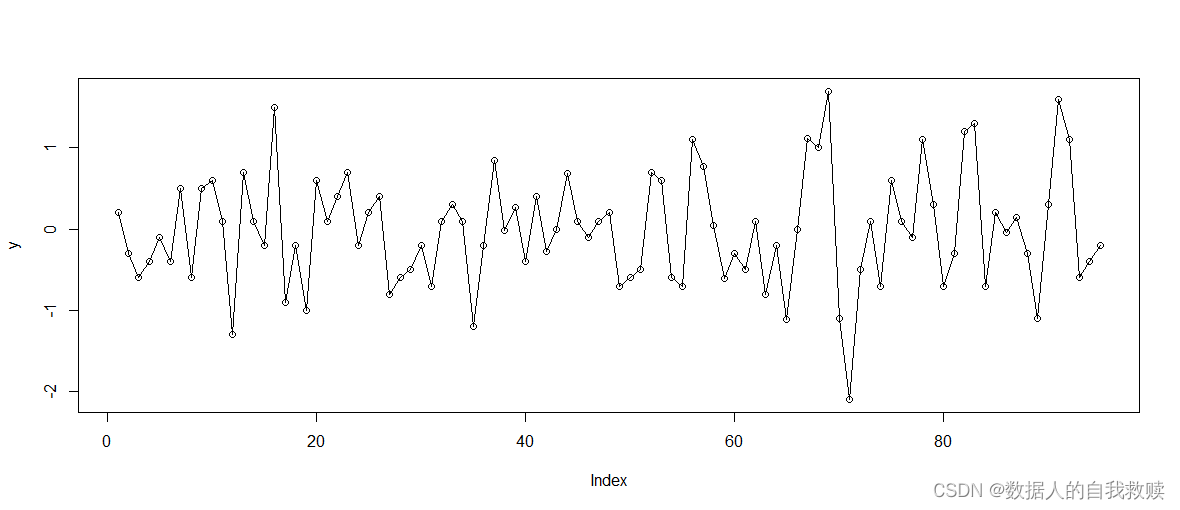
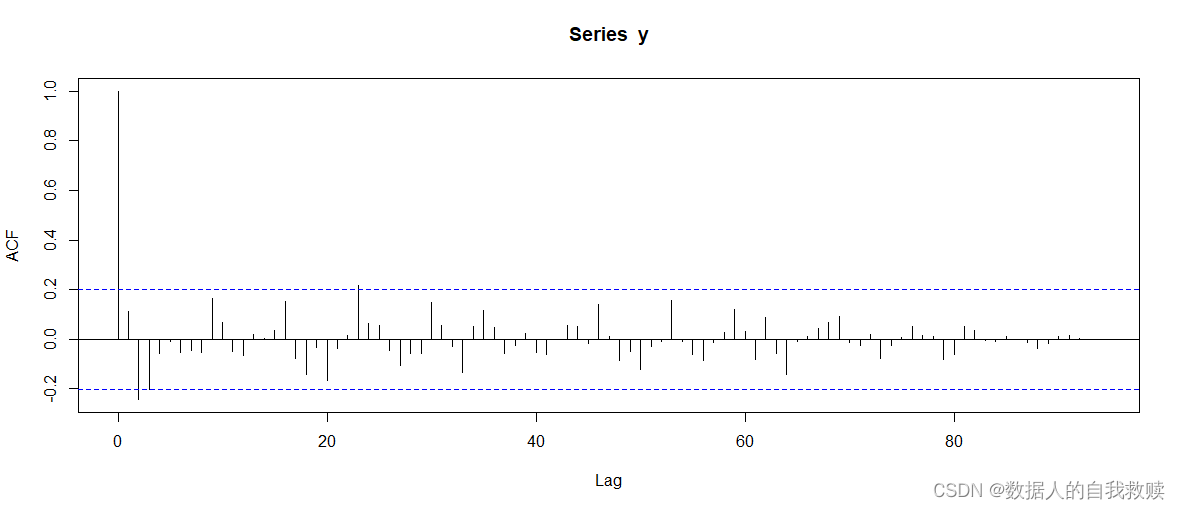
> z=diff(y)
> plot(z,type = "o",col=1)
> acf(y,300)
八、 第八题


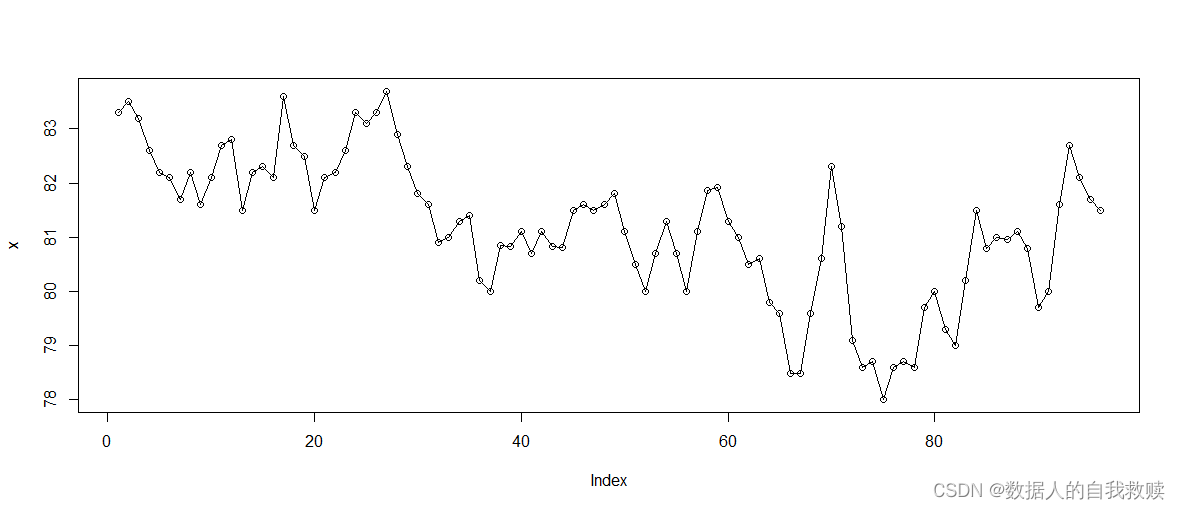
(1)非平稳(2)略(3)非平稳;平稳
> x=c(83.3 ,83.5 ,83.2 ,82.6 ,82.2 ,82.1 ,81.7 ,82.2 ,81.6 ,82.1 ,82.7 ,82.8 ,81.5 ,82.2 ,82.3 ,82.1 ,83.6 ,82.7 ,82.5 ,81.5 ,82.1 ,82.2 ,82.6 ,83.3 ,83.1 ,83.3 ,83.7 ,82.9 ,82.3 ,81.8 ,81.6 ,80.9 ,81 ,81.3 ,81.4 ,80.2 ,80 ,80.85 ,80.83 ,81.1 ,80.7 ,81.1 ,80.83 ,80.82 ,81.5 ,81.6 ,81.5 ,81.6 ,81.8 ,81.1 ,80.5 ,80 ,80.7 ,81.3 ,80.7 ,80 ,81.1 ,81.87 ,81.91 ,81.3 ,81 ,80.5 ,80.6 ,79.8 ,79.6 ,78.49 ,78.49 ,79.6 ,80.6 ,82.3 ,81.2 ,79.1 ,78.6 ,78.7 ,78 ,78.6 ,78.7 ,78.6 ,79.7 ,80 ,79.3 ,79 ,80.2 ,81.5 ,80.8 ,81 ,80.96 ,81.1 ,80.8 ,79.7 ,80 ,81.6 ,82.7 ,82.1 ,81.7 ,81.5)
> plot(x,type = "o",col=1)
> acf(x,300)
> y=diff(x)
> plot(y,type = "o",col=1)
> acf(y,300)
个人意见,还请各位读者批评指正!
|