| python2 使用arcpy自定义GIS工具箱,实现excel读取、空间插值 | 您所在的位置:网站首页 › arcpy读取shp › python2 使用arcpy自定义GIS工具箱,实现excel读取、空间插值 |
python2 使用arcpy自定义GIS工具箱,实现excel读取、空间插值
|
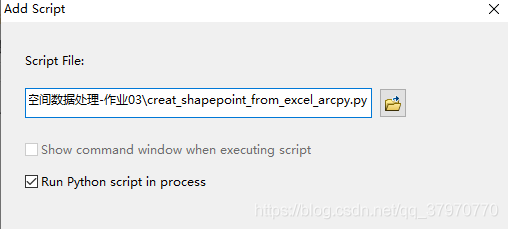
一、实验目的 1.掌握Arcpy基本语法、功能函数 2.学会使用Arcpy自定义GIS工具箱 3.使用arcpy进行空间插值 4.自定义创建的Arcmap制图模板,使用arcpy调节图例、注记、比例尺等位置 二、实验内容 1.arcpy包自定义工具箱,选择文件,生成新的文件名,按照第4列经、第5列纬度,生成点矢量图形. 2.按照第6列地面高程数据进行spline空间插值,生成空间插值后的图层,在第十一章Arcpy分析方法编程1的第75页,Arcpy栅格数据分析. 3.将插值后的高程图和点图层通过调用arcpy包叠加显示,自定义创建制制作模板,将图件按照图幅编号分幅输出为jpg图. 三、实验步骤及结果展示 1.右击Arctoolbox,添加工具箱,点击创建新的工具箱,命名为:Point shape created from Excel.tbx 2.为上述工具箱先创建代码,基于指定路径下的文件进行, 代码如下: # coding=gbk import arcpy import xlrd try: indir = 'E:\\秋季课程PPT\\Python空间数据处理\\python空间数据处理-作业03\\地质调查点基础数据表new.xls' xl = xlrd.open_workbook(indir) sheet = xl.sheet_by_name('data') samples = sheet.ncols lines = sheet.nrows #读取经纬度和高程值 longitude = sheet.col_values(4,1,lines-1) latitude = sheet.col_values(5,1,lines-1) elevation = sheet.col_values(6,1,lines-1) #关闭输入文件 #xl.close() 'Book' object has no attribute 'close' #创建shape outdir1 = 'E:\\秋季课程PPT\\Python空间数据处理\\python空间数据处理-作业03\\' outdir2 = 'pointshp_created_by_excel.shp' if arcpy.Exists(outdir2): arcpy.Delete_management(outdir2) #python2没有安装gdal,2020年1月7日后也不再支持pip install,因此无法使用ogr驱动功能 #driver = ogr.GetDriverByName('ESRI Shapefile') #if os.access(filename,os.F_OK): #driver.DeleteDataSource(outdir2) spatial_reference = arcpy.SpatialReference(4326) arcpy.CreateFeatureclass_management(outdir1,outdir2,"POINT")#,spatial_reference)加坐标就会报错,佛了 arcpy.AddField_management(outdir2, "elevation", "FLOAT",2)#2位小数 rows = arcpy.InsertCursor(outdir2) point = arcpy.Point() for i in range(0,lines-2): row = rows.newRow() point.X = longitude[i] point.Y = latitude[i] pointGeometry = arcpy.PointGeometry(point) row.shape = pointGeometry row.elevation = elevation[i] rows.insertRow(row) del row del rows arcpy.DefineProjection_management(outdir2, spatial_reference) except Exception as e: print str(e)然后再将路径赋值语句替换为arcpy.GetParameterAsText(0) arcpy.GetParameterAsText(1). 如下: # coding=gbk import arcpy import xlrd import os try: indir = arcpy.GetParameterAsText(0) outdir = arcpy.GetParameterAsText(1) xl = xlrd.open_workbook(indir) sheet = xl.sheet_by_name('data') samples = sheet.ncols lines = sheet.nrows #读取经纬度和高程值 longitude = sheet.col_values(4,1,lines-1) latitude = sheet.col_values(5,1,lines-1) elevation = sheet.col_values(6,1,lines-1) #关闭输入文件 #xl.close() 'Book' object has no attribute 'close' #创建shape pathdir = os.path.split(outdir)[0] filename = os.path.split(outdir)[1] #outdir2 = 'pointshp_created_by_excel.shp' if arcpy.Exists(filename): arcpy.Delete_management(filename) #python2没有安装gdal,2020年1月7日后也不再支持pip install,因此无法使用ogr驱动功能 #driver = ogr.GetDriverByName('ESRI Shapefile') #if os.access(filename,os.F_OK): #driver.DeleteDataSource(outdir2) spatial_reference = arcpy.SpatialReference(4326) arcpy.CreateFeatureclass_management(pathdir,filename,"POINT")#,spatial_reference)加坐标就会报错,佛了 arcpy.AddField_management(filename, "elevation", "FLOAT") rows = arcpy.InsertCursor(filename) point = arcpy.Point() for i in range(0,lines-2): row = rows.newRow() point.X = longitude[i] point.Y = latitude[i] pointGeometry = arcpy.PointGeometry(point) row.shape = pointGeometry row.elevation = elevation[i] rows.insertRow(row) del row del rows arcpy.DefineProjection_management(filename, spatial_reference) except Exception as e: print str(e)值得注意的是,在代码开始后就应该把它们放置在一起,方便代码的高效率运行,否则,若是在代码需要用到时才指定,会造成的结果是:输入一个文件后,就会运行后面的代码,运行一段时间,完毕之后,再指定第二个,就会启动第二个指定处后的代码,而一开始放置在一起指定,则用户不用等待第一个反应完后再指定第二个。代码见附件“creat_shapepoint_from_excel_arcpy.py”, 而 “creat_shapepoint_from_excel.py”为指定路径下的文件,为替换前的完整实验文件。
GIS的python窗口中运行, 结果如图: 显然是代码保存栅格时出现了问题。因此屏蔽保存代码,手动将缓存图层保存一下,命名为“outSplineBarriers1.tif”,如图: 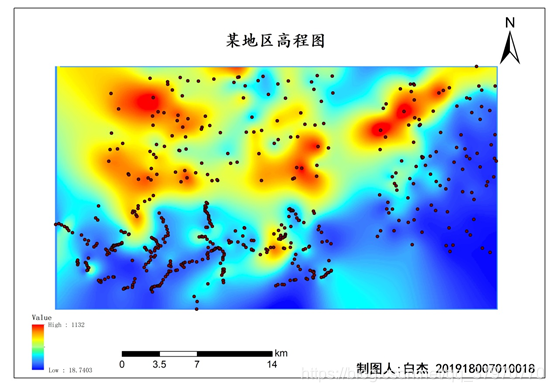 关于arcpy驱动GIS制图部分的代码,由于技术问题,暂时先没有。 关于arcpy驱动GIS制图部分的代码,由于技术问题,暂时先没有。
相互喜欢是爱情的保鲜剂吧。 |
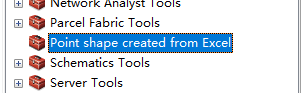
 3. creat_shapepoint_from_excel_arcpy.py为上述工具箱背后的代码,指定工具箱的两个输入参数:选择文件和生成新的文件名。 输入的excel文件属于tables,输出为shp
 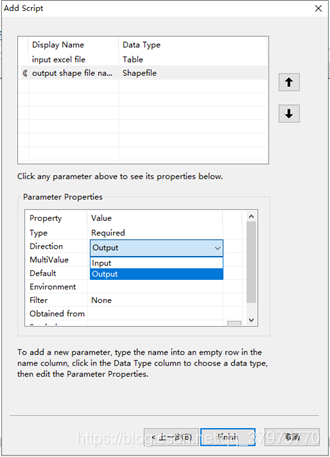 4.使用工具箱
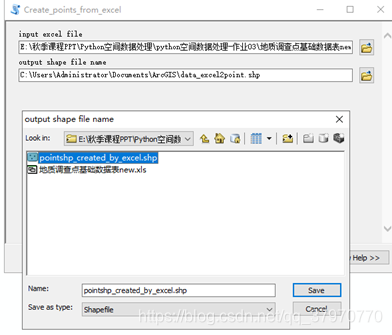 值得注意的是,在指定输入文件的时候,不能指定后缀为Table,因为指定后缀为Table的话,就会让进一步导入具体的sheet,而这与程序不符合,为保证程序的正确运行,指定后缀为file,即可。 5.工具箱运行结果展示:
 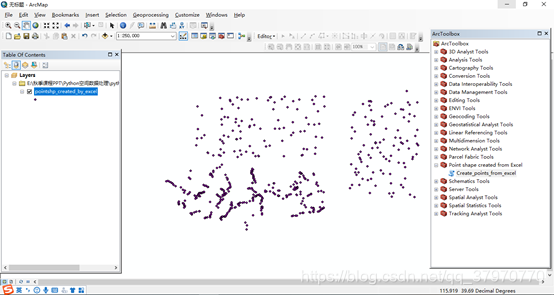 6.spline空间插值。插值介绍参考第十一章Arcpy分析方法编程1的第75页。 值得指出的是,若直接用无barries的Spline样条函数法插值,结果如下图:
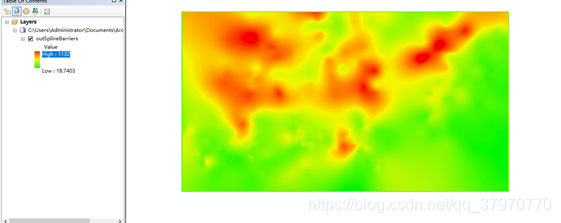
 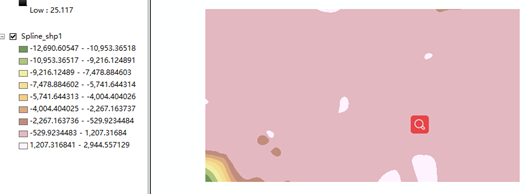 由图可以看出,此方法失去了局部特性,照顾了边缘,显然不能用Spline方法插值,会,因此,选择用有Barriers的Spline方法,即Spline with barriers方法进行插值。值得指出的是,先要画一个大的矢量面图层,基于以下角点坐标: 左:115.593700 dd 右:115.963166 dd 上:39.796028 dd 下:39.592500 dd将该图层作为barriers图层,命名为“spline_barriers.shp”,代码见spline_interpolation.py,
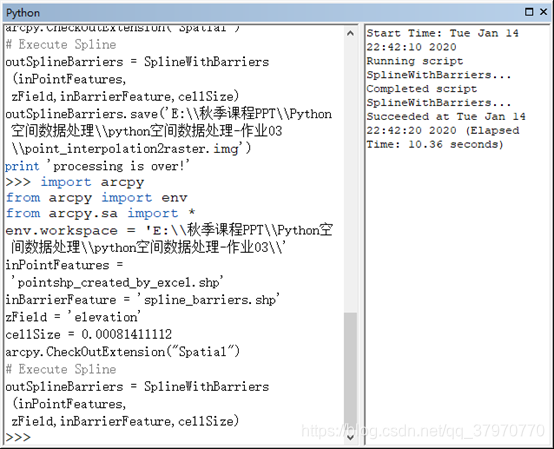
 值得指出的是同样的上述代码在IDLE中执行会报错,而在GIS窗口中的python命令窗中执行,则没有错误。 7.保存上述结果时,使用outSplineBarriers.save(‘E:/秋季课程PPT/Python空间数据处理/python空间数据处理-作业03/splinebout01.tif’)语句,但是发现问题是表明上看起来是完成了,但加载进来后发现,最下值是nodata值-3.40282e+038,
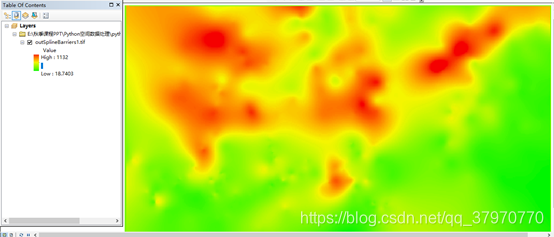 8.如图:
8.如图: 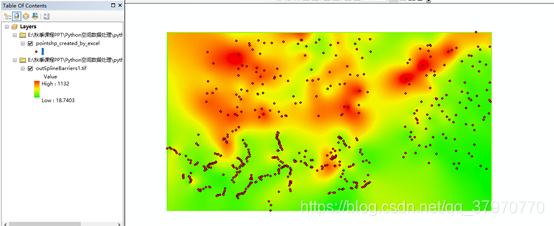 9.制图模板本。实验选择了比例尺、指北针、图例、注记,由于时间和技术因素,没有在arcpy中能够很好得调整好各部分位置,为使图像较为美观,加以手动调整,出图见“某地区高程图.jpg”,如下:
【本文地址】