|
话不多说先看效果图
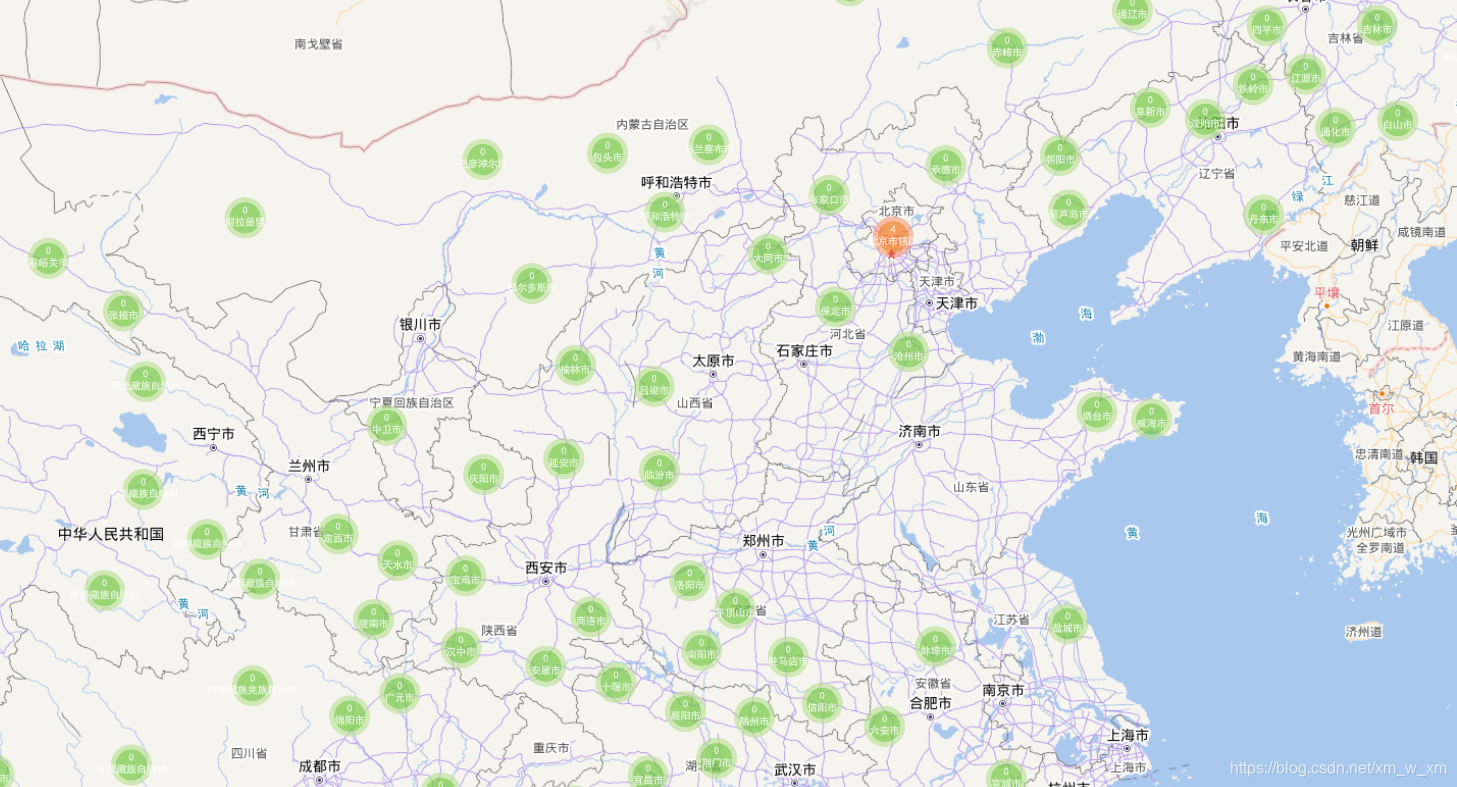
要实现的功能就是按照根据省份展示出各省上传的数据量
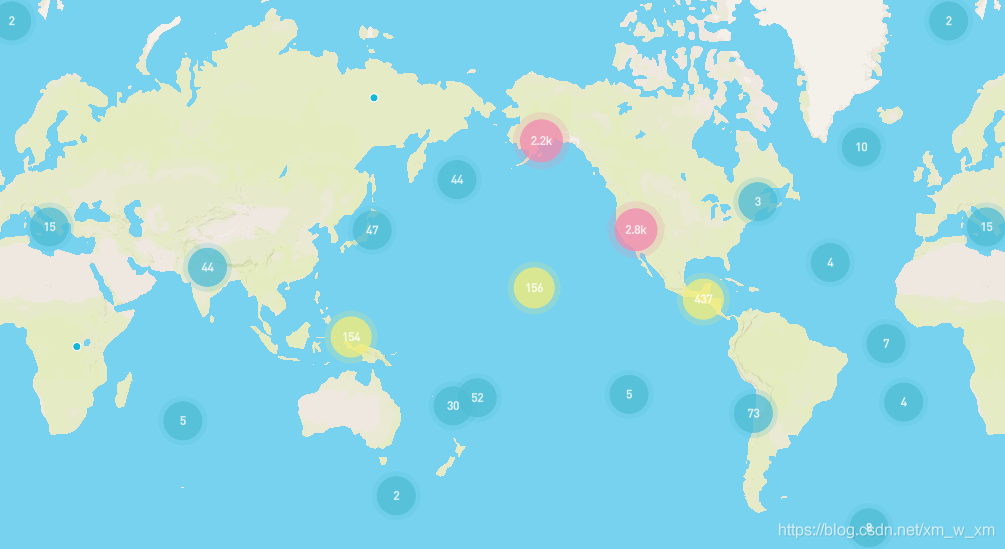
首先我们可以查看 mapboxgl官网有一个例子地址如下: https://docs.mapbox.com/mapbox-gl-js/example/cluster/
可以复制过来直接查看是否有聚合图
 是这样的之后我想把数据的颜色变得有些透明的颜色,将字体的颜色改成白色的 是这样的之后我想把数据的颜色变得有些透明的颜色,将字体的颜色改成白色的
https://docs.mapbox.com/mapbox-gl-js/style-spec/#layers-circle 这个链接就是修改circle样式的,
mapboxgl.accessToken =
'';;
var map = new mapboxgl.Map({
container: "map",
style: "mapbox://styles/mapbox/streets-v11",
center: [-65.017, -16.457],
zoom: 5
});
map.on("load", function() {
// 从GeoJSON数据添加一个新的源并设置“cluster”选项为true。GL-JS将把point_count属性添加到源数据中。
map.addSource("earthquakes", {
type: "geojson",
data:
"https://docs.mapbox.com/mapbox-gl-js/assets/earthquakes.geojson",
// data.data,//将上面的换成我所需要的
cluster: true,
clusterMaxZoom: 14, //最大缩放到群集点
clusterRadius: 50 // 每一组点的半径(=50)
});
// 外围有数字的圆圈,加晕染
map.addLayer({
id: "clusters",
type: "circle",
source: "earthquakes",
filter: ["has", "point_count"],
paint: {
//*蓝色,当点数小于100时为20px圆
//*点计数在100到750之间时为黄色,21px圆
//*点计数大于或等于750时为22像素的粉红色圆圈
"circle-color": [
"step",
["get", "point_count"],
"rgba(81, 187, 214, 0.8)",
100,
"rgba(241, 240, 117, 0.8)",
750,
"rgba(242, 140, 177, 0.8)"
],
"circle-radius": [
"step",
["get", "point_count"],
20, //蓝色,当点数小于100时为20px圆
100, //对应上面circle-color 数字,意思为100以内
21, //点计数在100到750之间时为黄色,21px圆
750, //对应上面circle-color 数字,意思为750以内
22 //点计数大于或等于750时为22像素的粉红色圆圈
],
// 这个是外边框的颜色 circle-stroke-color这个对应了上面circle-color
"circle-stroke-color": [
"step",
["get", "point_count"],
"rgba(81, 187, 214, 0.2)",
100,
"rgba(241, 240, 117, 0.2)",
750,
"rgba(242, 140, 177, 0.2)"
],
// 这个是外边框晕染的范围
"circle-stroke-width": [
"step",
["get", "point_count"],
5, //蓝色晕染长度,当点数小于100时为5px晕染
100, //对应上面circle-color 数字,意思为100以内
6, //点计数在100到750之间时为黄色,6px晕染
750, //对应上面circle-color 数字,意思为750以内
7 //点计数大于或等于750时为7px像素的粉红色晕染
]
}
});
//聚合图圆圈中的数字
map.addLayer({
id: "cluster-count",
type: "symbol",
source: "earthquakes",
filter: ["has", "point_count"],
layout: {
"text-field": "{point_count_abbreviated}",
"text-font": ["DIN Offc Pro Medium", "Arial Unicode MS Bold"],
"text-size": 12
},
// 添加这个就可以改变圆圈内字样式,这里我改变了他的颜色
paint: {
"text-color": "#fff",
"text-opacity": 1
}
});
// 聚合图中没有数字的显示小圆点
map.addLayer({
id: "unclustered-point",
type: "circle",
source: "earthquakes",
filter: ["!", ["has", "point_count"]],
paint: {
"circle-color": "#11b4da",
"circle-radius": 4,
"circle-stroke-width": 1,
"circle-stroke-color": "#fff"
}
});
// 单击时检查群集
map.on("click", "clusters", function(e) {
var features = map.queryRenderedFeatures(e.point, {
layers: ["clusters"]
});
var clusterId = features[0].properties.cluster_id;
map
.getSource("earthquakes")
.getClusterExpansionZoom(clusterId, function(err, zoom) {
if (err) return;
map.easeTo({
center: features[0].geometry.coordinates,
zoom: zoom
});
});
});
map.on("mouseenter", "clusters", function() {
map.getCanvas().style.cursor = "pointer";
});
map.on("mouseleave", "clusters", function() {
map.getCanvas().style.cursor = "";
});
});
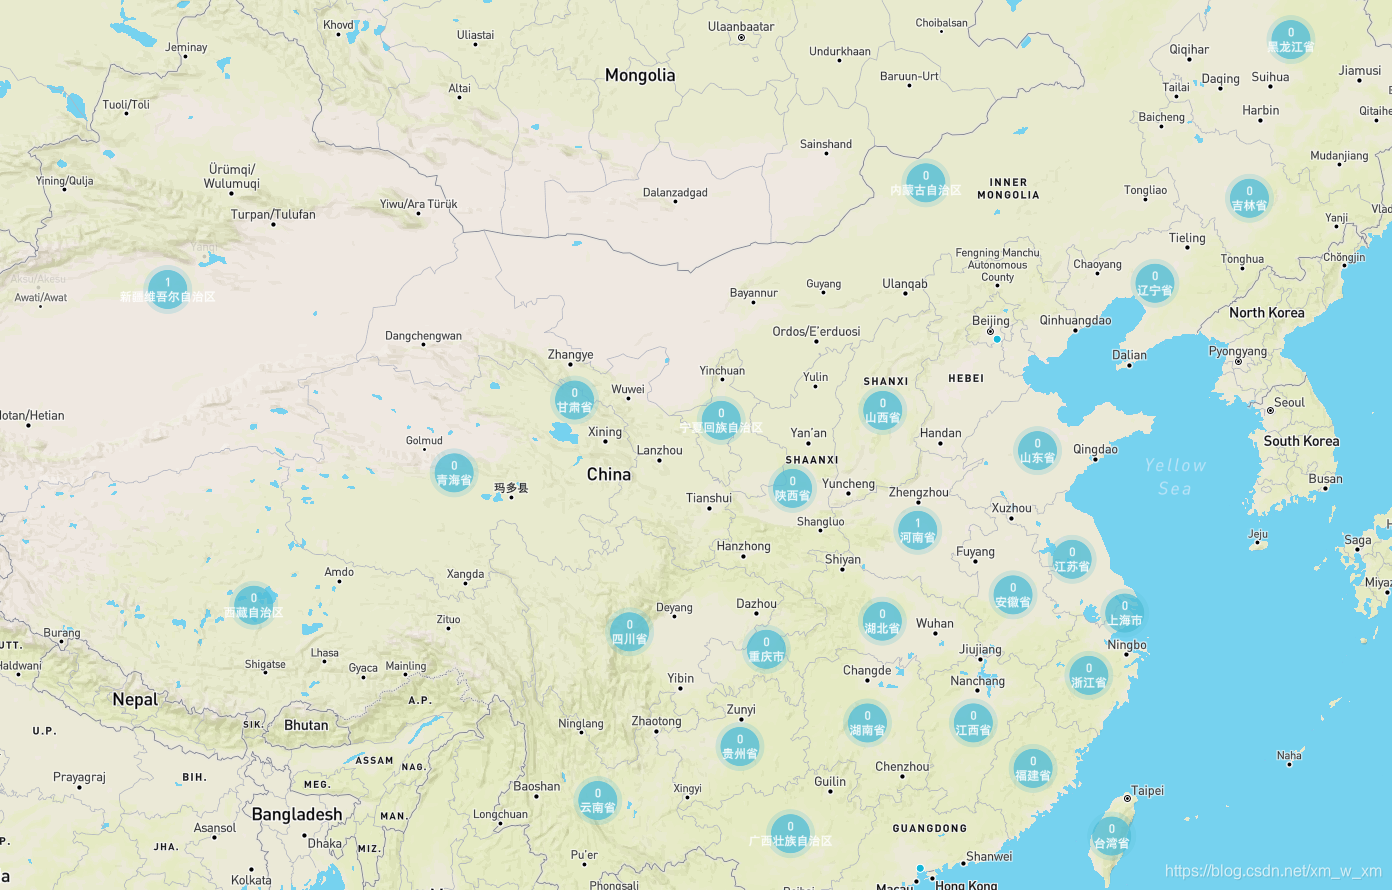
到这里我们就已经成功一半了,那么我们现在换掉mapbox官网的数据,展示我们自己的数据,
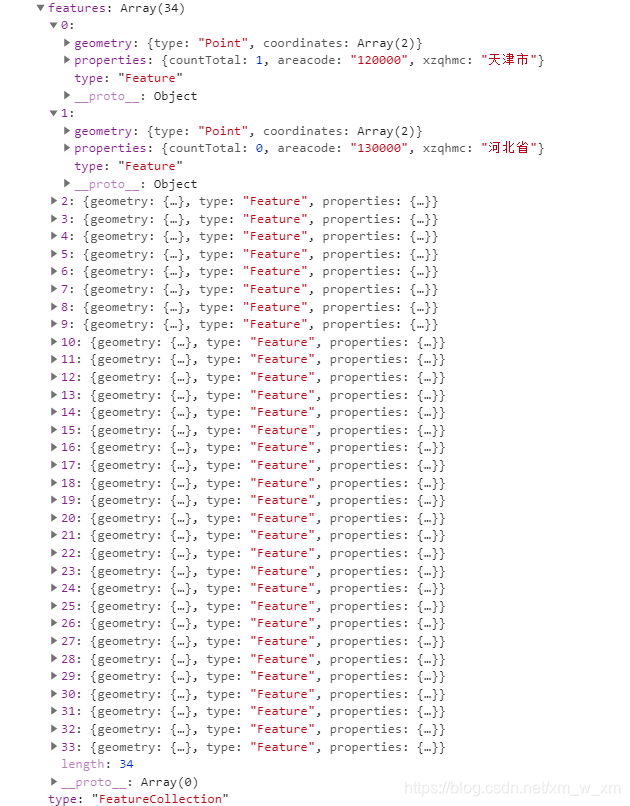
我的数据是酱紫的,所以改下数据就可以了
map.on("load", function() {
// 从GeoJSON数据添加一个新的源并设置“cluster”选项为true。GL-JS将把point_count属性添加到源数据中。
map.addSource("earthquakes", {
type: "geojson",
data:
// "https://docs.mapbox.com/mapbox-gl-js/assets/earthquakes.geojson",
data.data,//将上面的换成我所需要的
cluster: true,
clusterMaxZoom: 14, //最大缩放到群集点
clusterRadius: 50 // 每一组点的半径(=50)
});
// 外围有数字的圆圈,加晕染
map.addLayer({
id: "clusters",
type: "circle",
source: "earthquakes",
filter: ["has", "countTotal"], //这个地方是返回值是countTotal,所以要改成你要展示的数字
paint: {
//*蓝色,当点数小于100时为20px圆
//*点计数在100到750之间时为黄色,21px圆
//*点计数大于或等于750时为22像素的粉红色圆圈
"circle-color": [
"step",
["get", "countTotal"],
"rgba(81, 187, 214, 0.8)",
100,
"rgba(241, 240, 117, 0.8)",
750,
"rgba(242, 140, 177, 0.8)"
],
"circle-radius": [
"step",
["get", "countTotal"],
20, //蓝色,当点数小于100时为20px圆
100, //对应上面circle-color 数字,意思为100以内
21, //点计数在100到750之间时为黄色,21px圆
750, //对应上面circle-color 数字,意思为750以内
22 //点计数大于或等于750时为22像素的粉红色圆圈
],
// 这个是外边框的颜色 circle-stroke-color这个对应了上面circle-color
"circle-stroke-color": [
"step",
["get", "countTotal"],
"rgba(81, 187, 214, 0.2)",
100,
"rgba(241, 240, 117, 0.2)",
750,
"rgba(242, 140, 177, 0.2)"
],
// 这个是外边框晕染的范围
"circle-stroke-width": [
"step",
["get", "countTotal"],
5, //蓝色晕染长度,当点数小于100时为5px晕染
100, //对应上面circle-color 数字,意思为100以内
6, //点计数在100到750之间时为黄色,6px晕染
750, //对应上面circle-color 数字,意思为750以内
7 //点计数大于或等于750时为7px像素的粉红色晕染
]
}
});
//聚合图圆圈中的数字
map.addLayer({
id: "cluster-count",
type: "symbol",
source: "earthquakes",
filter: ["has", "countTotal"],
layout: {
// "text-field": "{point_count_abbreviated}", //原来mapbox的值
"text-field": "{countTotal}" + "\n" + "{xzqhmc}",//我们找到我们自己要展示的值
"text-font": ["DIN Offc Pro Medium", "Arial Unicode MS Bold"],
"text-size": 12
},
// 添加这个就可以改变圆圈内字样式,这里我改变了他的颜色
paint: {
"text-color": "#fff",
"text-opacity": 1
}
});
// 聚合图中没有数字的显示小圆点
map.addLayer({
id: "unclustered-point",
type: "circle",
source: "earthquakes",
filter: ["!", ["has", "countTotal"]],
paint: {
"circle-color": "#11b4da",
"circle-radius": 4,
"circle-stroke-width": 1,
"circle-stroke-color": "#fff"
}
});
// 单击时检查群集
map.on("click", "clusters", function(e) {
var features = map.queryRenderedFeatures(e.point, {
layers: ["clusters"]
});
var clusterId = features[0].properties.cluster_id;
map
.getSource("earthquakes")
.getClusterExpansionZoom(clusterId, function(err, zoom) {
if (err) return;
map.easeTo({
center: features[0].geometry.coordinates,
zoom: zoom
});
});
});
map.on("mouseenter", "clusters", function() {
map.getCanvas().style.cursor = "pointer";
});
map.on("mouseleave", "clusters", function() {
map.getCanvas().style.cursor = "";
});
});
改下颜色因为我获取的数据量很小没有很大,最后的结果就是第一张图
|