|
项目来自和鲸社区奥运会数据集分析
1. 数据载入与总览
1.1 数据加载
import numpy as np
import pandas as pd
%matplotlib inline
import matplotlib.pyplot as plt
from wordcloud import WordCloud, STOPWORDS
import warnings
warnings.filterwarnings('ignore')
#plt.rcParams ['font.sans-serif'] = ['SimHei'] # 坐标轴标题正常显示中文
#plt.rcParams ['axes.unicode_minus'] = False # 坐标轴刻度正常显示负号
"""
也可以修改文件.\Anaconda\Lib\site-packages\matplotlib\mpl-data\matplotlibrc
249 font.family : sans-serif,去除注释
257 font.sans-serif : Microsoft YaHei, DejaVu Sans, Bitstream Vera Sans, Computer Modern Sans Serif, Lucida Grande, Verdana, Geneva, Lucid, Arial, Helvetica, Avant Garde, sans-serif,去除注释并添加字体(Microsoft YaHei)
"""
athlete_events = pd.read_csv('./athlete_events.csv')
1.2 数据总览
athlete_events.head() # 查看前n行(默认5)

athlete_events.isnull().sum() # 查看各个字段的空值的个数

athlete_events.info() # 查看列名及其数据类型

athlete_events.describe() # 数据的描述性统计

2. 奥运会运动项目词云
athlete_events.Sport.unique() # 对Sport去重得到所有的运动项目名称

stopwords = set(STOPWORDS) # 设置停用词
def show_wordcloud(data, title = None):
wordcloud = WordCloud(
background_color= 'white',
stopwords= stopwords,
max_words= 200,
max_font_size= 40,
scale= 3, # scale,缩放比例
random_state= 1).generate(str(data))
fig = plt.figure(1, figsize= (15, 15))
plt.axis('off')
if title:
fig.suptitle(title, fontsize = 20)
fig.subplots_adjust(top = 2.3)
plt.imshow(wordcloud)
plt.show()
show_wordcloud(athlete_events['Sport'], title = "往届奥运比赛项目词云")

3. 查看参赛者的男女基本信息
原项目从这里开始是用plotly绘制的,而我因为是在jupyterlab中写的,需要用插件才能显示绘制效果,我嫌麻烦就用matplotlib代替了
3.1. 120年来参赛者的男女比例
"""
labels:饼图中每个楔形的标签
autopct:楔形的数值标签,百分比形式,.1f是一位小数
startangle:饼图的绘制起点的角度
counterclock: 饼图的绘制方向,默认为True
wedgeprops:
width: 甜甜圈的大小,范围是[0,1]
edgecolor: 每个楔形边缘的颜色
"""
plt.pie(athlete_events['Sex'].value_counts(), labels= ['男', '女'], autopct='%1.1f%%', startangle=90, counterclock = False, wedgeprops= dict(width=0.6, edgecolor='w'))
plt.axis('equal') # 保证你画的圆是圆,而不是椭圆
plt.title("参赛者的男女比例")
plt.show()

3.2. 查看参赛者的男性与女性的年龄分布
s_f = athlete_events.query("Sex == 'F'")
s_m = athlete_events.query("Sex == 'M'")
fif, ax = plt.subplots(ncols= 2,figsize = (8, 5))
s_f.Age.plot(kind = 'box', ax = ax[0], title = "男性年龄分布")
s_m.Age.plot(kind = 'box', ax = ax[1], title = "女性年龄分布")
plt.show()
"""
# Age中有空值,boxplot无法作用
s_f = athlete_events[athlete_events['Sex'] == 'F'].Age.dropna()
s_m = athlete_events[athlete_events['Sex'] == 'M'].Age.dropna()
box1, box2 = s_f, s_m
plt.subplots(figsize = (6,10))
plt.boxplot([box1, box2])
plt.show()
"""

超出箱线图的上限和下限都为 异常值,男性与女性的年龄异常值都集中在较大值一侧,所以年龄分布都呈右偏态。
3.3. 查看1896-2014年男女参赛者的平均年龄变化
f_year_mean = athlete_events[athlete_events['Sex'] == 'F'].groupby('Year').Age.mean()
m_year_mean = athlete_events[athlete_events['Sex'] == 'M'].groupby('Year').Age.mean()
fig, ax = plt.subplots(figsize = (15, 8))
ax.plot(f_year_mean, label = "女性")
ax.plot(m_year_mean, label = "男性")
plt.legend(loc = 'upper right') # 显示图例,位置为右上方
plt.title(label = "历年男性女性参赛选手的平均年龄变化")
plt.show()

3.4. 查看120年来🌞夏季🌞奥运会获奖运动员不同性别的平均年龄变化
medal_s_f = athlete_events[(athlete_events['Sex'] == 'F')&
(athlete_events['Season'] == 'Summer')&
(athlete_events['Medal'].notnull())].groupby('Year').Age.mean()
medal_s_m = athlete_events[(athlete_events['Sex'] == 'M')&
(athlete_events['Season'] == 'Summer')&
(athlete_events['Medal'].notnull())].groupby('Year').Age.mean()
fig, ax = plt.subplots(figsize = (15, 8))
ax.plot(medal_s_f, label = "获奖女性")
ax.plot(medal_s_m, label = "获奖男性")
"""
'best' 0
'upper right' 1
'upper left' 2
'lower left' 3
'lower right' 4
'right' 5
'center left' 6
'center right' 7
'lower center' 8
'upper center' 9
'center' 10
"""
plt.legend(loc = 1)
plt.title(label = "历年夏季🌞奥运会获得奖牌的男性女性参赛选手的平均年龄变化")
plt.show()
 获奖男性运动员的平均年龄普遍比获奖女性运动员的平均年龄大,但在近年来,年龄差距在不断缩小。 获奖男性运动员的平均年龄普遍比获奖女性运动员的平均年龄大,但在近年来,年龄差距在不断缩小。
3.5. 查看120年来❄️冬季❄️奥运会获奖运动员不同性别的平均年龄变化
medal_w_f = athlete_events[(athlete_events['Sex'] == 'F')&
(athlete_events['Season'] == 'Winter')&
(athlete_events['Medal'].notnull())].groupby('Year').Age.mean()
medal_w_m = athlete_events[(athlete_events['Sex'] == 'M')&
(athlete_events['Season'] == 'Winter')&
(athlete_events['Medal'].notnull())].groupby('Year').Age.mean()
fig, ax = plt.subplots(figsize = (15, 8))
ax.plot(medal_w_f, label = "获奖女性")
ax.plot(medal_w_m, label = "获奖男性")
plt.legend(loc = 1)
plt.title(label = "历年冬季❄️奥运会获得奖牌的男性女性参赛选手的平均年龄变化")
plt.show()

4. 在120年来Top 20🏅得金牌最多的国家
和原项目不同,这里我用了Team做为分组
team_medal = athlete_events.groupby(['Team']).Medal.value_counts().reset_index(name = 'Team_Count')
top20_team_medal = team_medal[team_medal.Medal == 'Gold'].sort_values(by = 'Team_Count', ascending = False).head(20)
top20_team_medal = top20_team_medal.set_index(top20_team_medal.Team)
# rot: x轴刻度标签旋转角度
top20_team_medal.plot(kind = 'bar', figsize = (12, 9), rot = -30, title = "Top 20 的金牌数🏅最多的国家")
plt.show()

5. 最热门🔥的体育项目
athlete_events.Sport.value_counts().plot(kind = 'bar',figsize = (12, 9), title = "最热门的体育项目")
plt.show()

6. 中国🇨🇳奥运会Performance
6.1. 中国历届奥运会运动员获得奖牌人数
china_medal = china.groupby('Year').Medal.value_counts().reset_index(name = "medal_counts")
x0 = china_medal[china_medal.Medal == 'Gold'].Year
x1 = china_medal[china_medal.Medal == 'Silver'].Year
x2 = china_medal[china_medal.Medal == 'Bronze'].Year
y0 = china_medal[china_medal.Medal == 'Gold'].medal_counts
y1 = china_medal[china_medal.Medal == 'Silver'].medal_counts
y2 = china_medal[china_medal.Medal == 'Bronze'].medal_counts
fig, ax = plt.subplots(figsize = (12, 9))
width = 0.35
ax.bar(x0 - width, y0, width, label = "金牌", color = 'Gold')
ax.bar(x1, y1, width, label = "银牌", color = 'Silver')
ax.bar(x2 + width, y2, width, label = "铜牌", color = 'Brown') # 铜色是什么色啊2333
plt.title("中国历届奥运会运动员获得 金牌🏅 银牌🥈 铜牌🥉 的人数")
plt.legend()
plt.show()

china = athlete_events[athlete_events['Team'] == 'China']
china_all_medal = china[china.Medal.isin(['Gold', 'Silver', 'Bronze'])]
print("2008年获奖运动员人数:{}。".format(china_all_medal[china_all_medal.Year == 2008].shape[0]))
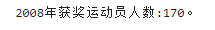
一直到1992年,冬季奥运会与夏季奥运会都是在同一年举行的。冬季奥运会是从1994年开始4年举办一次,夏季奥运会是从1996开始4年举办一次。所以在下面的柱状图📊中,1992年及之前的金牌人数数据都是在一个柱状图中。 在1996年的第一次夏季奥运会上,中国队有66人获得了银牌🥈,也是这么多年以来银牌获得人数最多的一届。在近几届的夏季奥运会上,中国表现的都很不错。尤其在2008年夏季北京奥运会,中国共有170名运动员获得了奖牌,其中有72人获得了金牌,49人获得了银牌、49人获得了铜牌。
6.2 中国那些运动项目获金牌数最多。
china_gold = china[china.Medal == 'Gold']
china_gold.groupby('Sport').Medal.value_counts().sort_values(ascending = False)

原项目后面还有一个前10运动的漏斗图,matplotlib没有漏斗图,,,
|