| 【收藏】stata绘图之graph bar 从经典到高级 | 您所在的位置:网站首页 › stata中画图命令 › 【收藏】stata绘图之graph bar 从经典到高级 |
【收藏】stata绘图之graph bar 从经典到高级
|
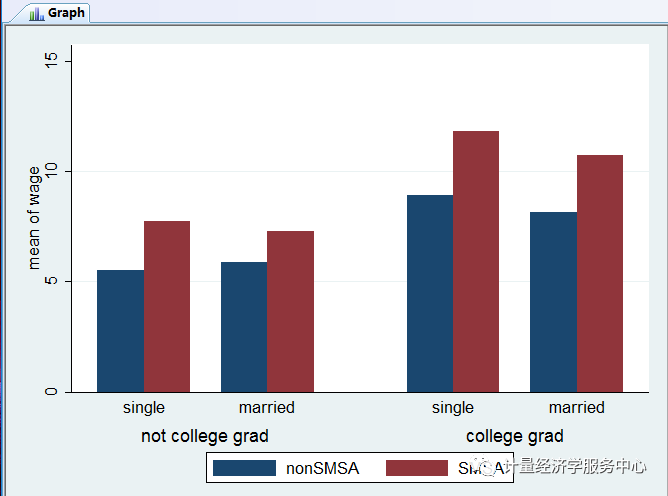
sysuse nlsw88, clear graph bar (mean) wage, over(smsa) over(married) over(collgrad) title("Average Hourly Wage, 1988, Women Aged 34-46") subtitle("by College Graduation, Marital Status, and SMSA residence") note("Source: 1988 data from NLS, U.S. Dept. of Labor, Bureau of Labor Statistics") 结果为:
累加柱体或者横向条形图 简单的操作命令为 sysuse educ99gdp, clear graph hbar (mean) public private, over(country) graph hbar (mean) public private, over(country) stack 完整的案例代码如下: . sysuse educ99gdp, clear generate total = private + public graph hbar (asis) public private,over(country, sort(total) descending) stack title( "Spending on tertiary education as % of GDP,1999", span pos(11) ) subtitle(" ") note("Source: OECD, Education at a Glance 2002", span) 结果为:
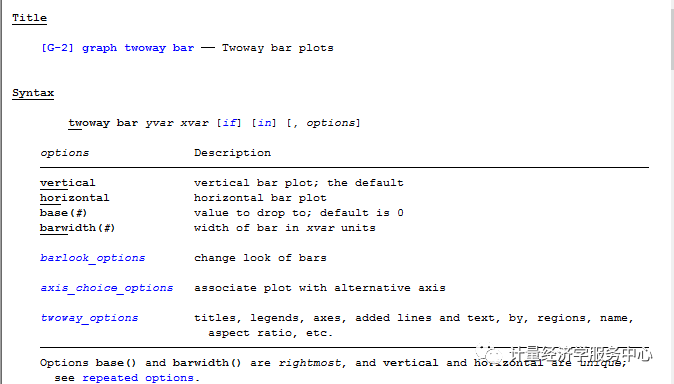
二维柱状图 二维柱状图的代码帮助为 help twoway bar
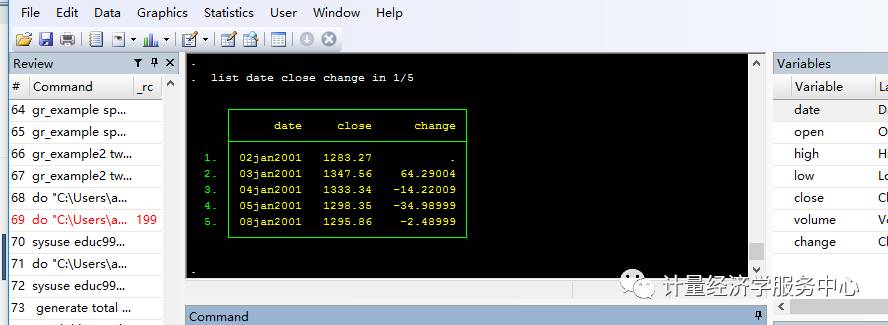
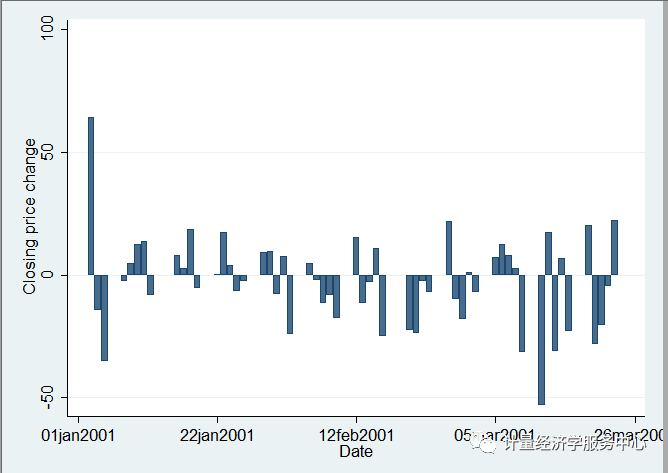
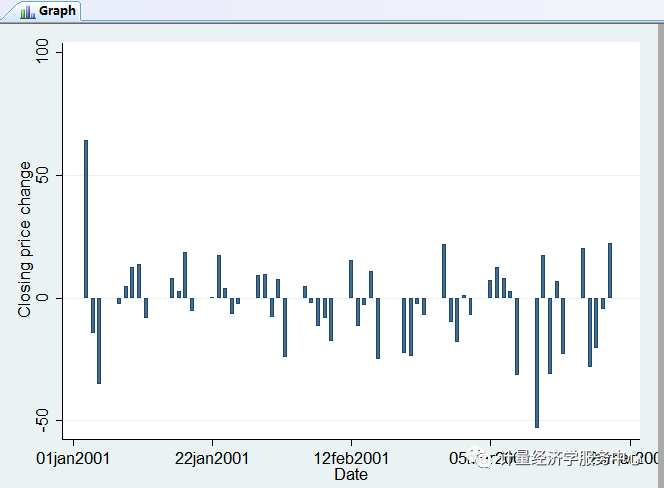
菜单式操作为 Graphics > Twoway graph (scatter, line, etc.) 经典介绍案例: sysuse sp500 list date close change in 1/5 twoway bar change date in 1/57 twoway bar change date in 1/57, barw(.6)
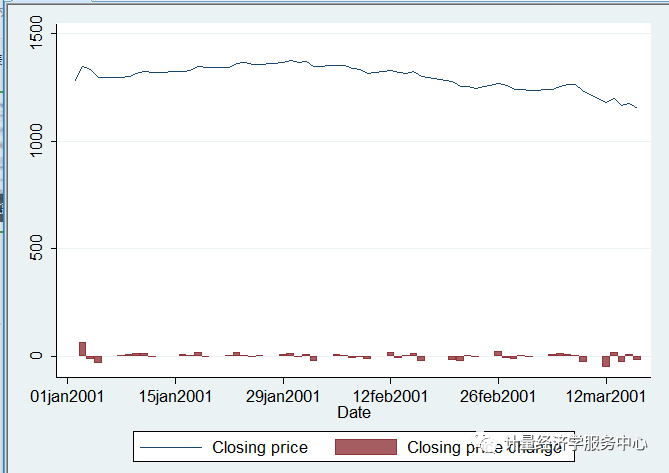
advanced use The useful thing about twoway bar is that it can be combined with other twoway plottypes: twoway line close date || bar change date || in 1/52
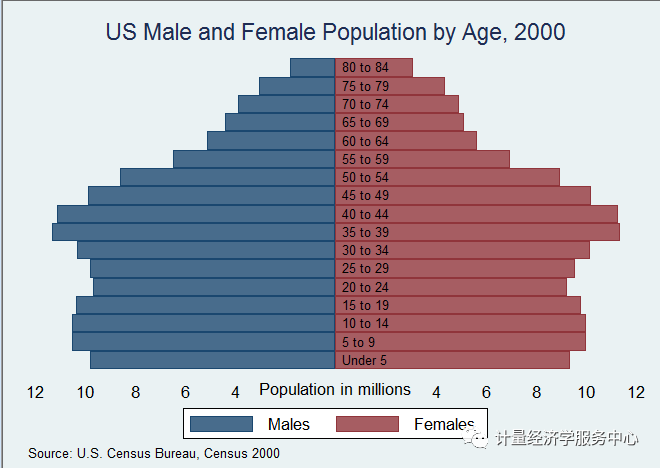
sysuse pop2000, clear list agegrp maletotal femtotal replace maletotal = -maletotal/1e+6 replace femtotal = femtotal/1e+6 twoway bar maletotal agegrp, horizontal xvarlab(Males) || bar femtotal agegrp, horizontal xvarlab(Females) || ylabel(1(1)17, angle(horizontal) valuelabel labsize(*.8)) xtitle("Population in millions") ytitle("") xlabel(-10 "10" -7.5 "7.5" -5 "5" -2.5 "2.5" 2.5 5 7.5 10) legend(label(1 Males) label(2 Females)) title("US Male and Female Population by Age") subtitle("Year 2000") note("Source: U.S. Census Bureau, Census 2000, Tables 1, 2 and 3", span)
更多高级绘图及计量经济学和stata应用,尽在2017年8月4-7日stata课程。关于图形这部分章节内容,中心将从图形介绍以及图形的使用功能简介意义方面着手介绍,让大家知道什么情况下应该用什么图。 另外学会各种图形的帮助文件能够画出更多精美实用的图形。 参考资料:stata帮助文件 (课程将会把讲义,包括各模型附带的stata实现过程(do文档)全部开放给大家)
|

【本文地址】