|
背景
在ECharts中,设置柱状图背景色,可通过backgroundColor设置,但仅限于单系列柱状图,所以在多系列柱状图中就需要用下面的方式设置
解决方案
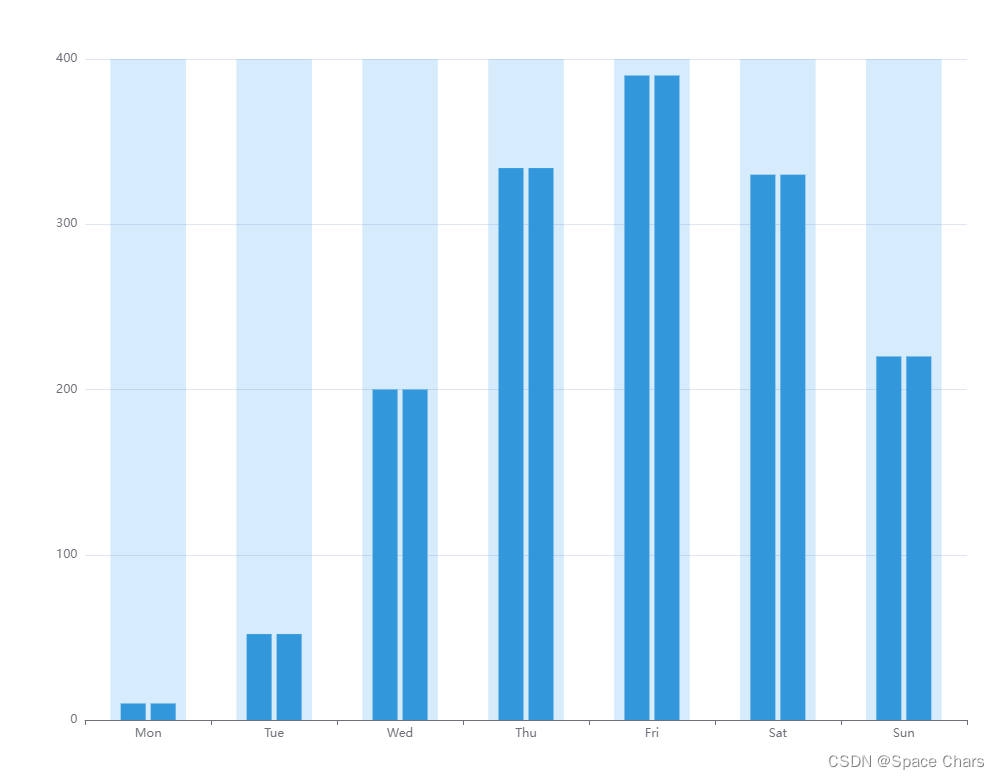
1. xAxis.splitArea
如果设置的背景图的宽度占比为100%,则可以使用该方法,因为该方法不能指定背景宽度
option = {
color: ["#3398DB"],
tooltip: {
trigger: "axis",
axisPointer: {
type: "shadow"
}
},
grid: {},
xAxis: [{
type: "category",
data: ["Mon", "Tue", "Wed", "Thu", "Fri", "Sat", "Sun"],
splitArea:{
show:true,
interval:0,
areaStyle:{
//多类目时,可以使用数组设置颜色
color:[
'rgba(51, 154, 240,0.2)',
'rgba(51, 154, 240,0.3)',
'rgba(51, 154, 240,0.4)',
'rgba(51, 154, 240,0.5)',
'rgba(51, 154, 240,0.6)',
'rgba(51, 154, 240,0.7)',
'rgba(51, 154, 240,0.8)'
]
}
}
}],
yAxis: [{
type: "value"
}],
series: [{
name: "直接访问",
type: "bar",
barWidth: "60%",
data: [10, 52, 200, 334, 390, 330, 220]
}]
}
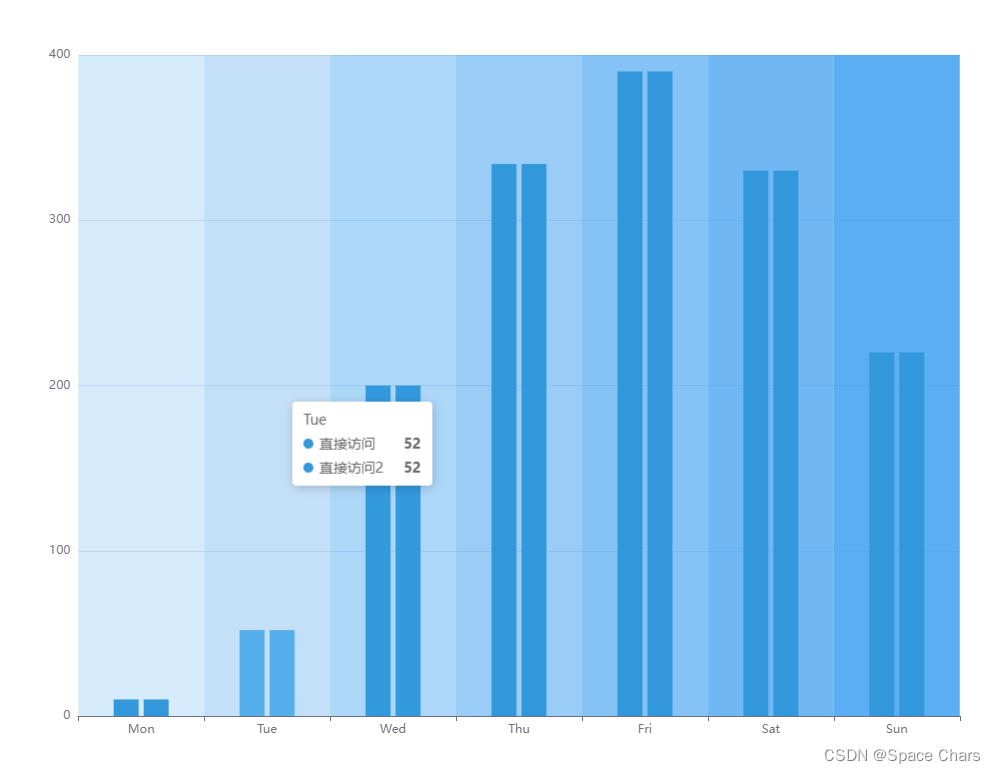
自定义图表
自定义图标适用于任何坐标系,且显示样式可根据需要自定义实现,所以更适用于多系列柱状图绘制背景图的需求
自定义图标,起始坐标都是在左上角开始
option = {
color: ['#3398DB'],
tooltip: {
trigger: 'axis',
axisPointer: {
type: 'shadow'
}
},
grid: {},
xAxis: [
{
type: 'category',
data: ['Mon', 'Tue', 'Wed', 'Thu', 'Fri', 'Sat', 'Sun'],
boundaryGap: true
}
],
yAxis: [
{
type: 'value'
}
],
series: [
{
type: 'custom',
itemStyle: {
color: 'rgba(51, 154, 240,0.2)'
},
renderItem: function (params, api) {
//获取对应类目的axisTick中心点坐标
var start = api.coord([api.value(0)]);
//通过坐标系的宽度和类目数,计算单个类目的背景
var width=(params.coordSys.width/7)*0.6;
return {
type: 'rect',
shape: {
// 相对左上角坐标
x: start[0]-width/2,
y: params.coordSys.y,
width:width,
height: params.coordSys.height,
},
style: api.style()
};
},
data: [0, 0, 0, 0, 0, 0, 0]
},
{
name: '直接访问',
type: 'bar',
barWidth: '25',
data: [10, 52, 200, 334, 390, 330, 220]
},
{
name: '直接访问2',
type: 'bar',
barWidth: '25',
data: [10, 52, 200, 334, 390, 330, 220]
}
]
};
|