| matplotlib绘制多子图和子图设置属性 | 您所在的位置:网站首页 › plt设置子图大小 › matplotlib绘制多子图和子图设置属性 |
matplotlib绘制多子图和子图设置属性
|
在matplotlib的pyplot模块中,许多函数都是对当前的Figure或Axes对象进行处理,比如说:plt.plot()实际上会通过plt.gca()获得当前的Axes对象ax,然后再调用ax.plot()方法实现真正的绘图。本篇文章将分享如何利用subplot返回的Figure类和axes.Axes类或者array of Axes进行子图绘制和相关属性设置。 首先导入matplotlib.pyplot import matplotlib.pyplot as plt1.设置画布大小和分辨率 plt.rcParams['figure.figsize'] = (7.5, 6) ## 分辨率 1500*1200 plt.rcParams['figure.dpi'] = 200 plt.rcParams['savefig.dpi'] = 2002.然后设置自己需要的多图数量,并获取Figure类和axes.Axes类(或者Axes类组) ## 获取2*2的子图 fig , ax = plt.subplots(2, 2) 3.绘制任意四个子图 ## 索引顺序按照从左到右,从上到下 x = np.linspace(-3,3,100) y1 = np.sin(x) y2 = np.cos(x) y3 = 1 / x y4 = np.exp(x) ax[0, 0].plot(x, y1) ax[0, 1].plot(x, y2) ax[1, 0].plot(x, y3) ax[1, 1].plot(x, y4)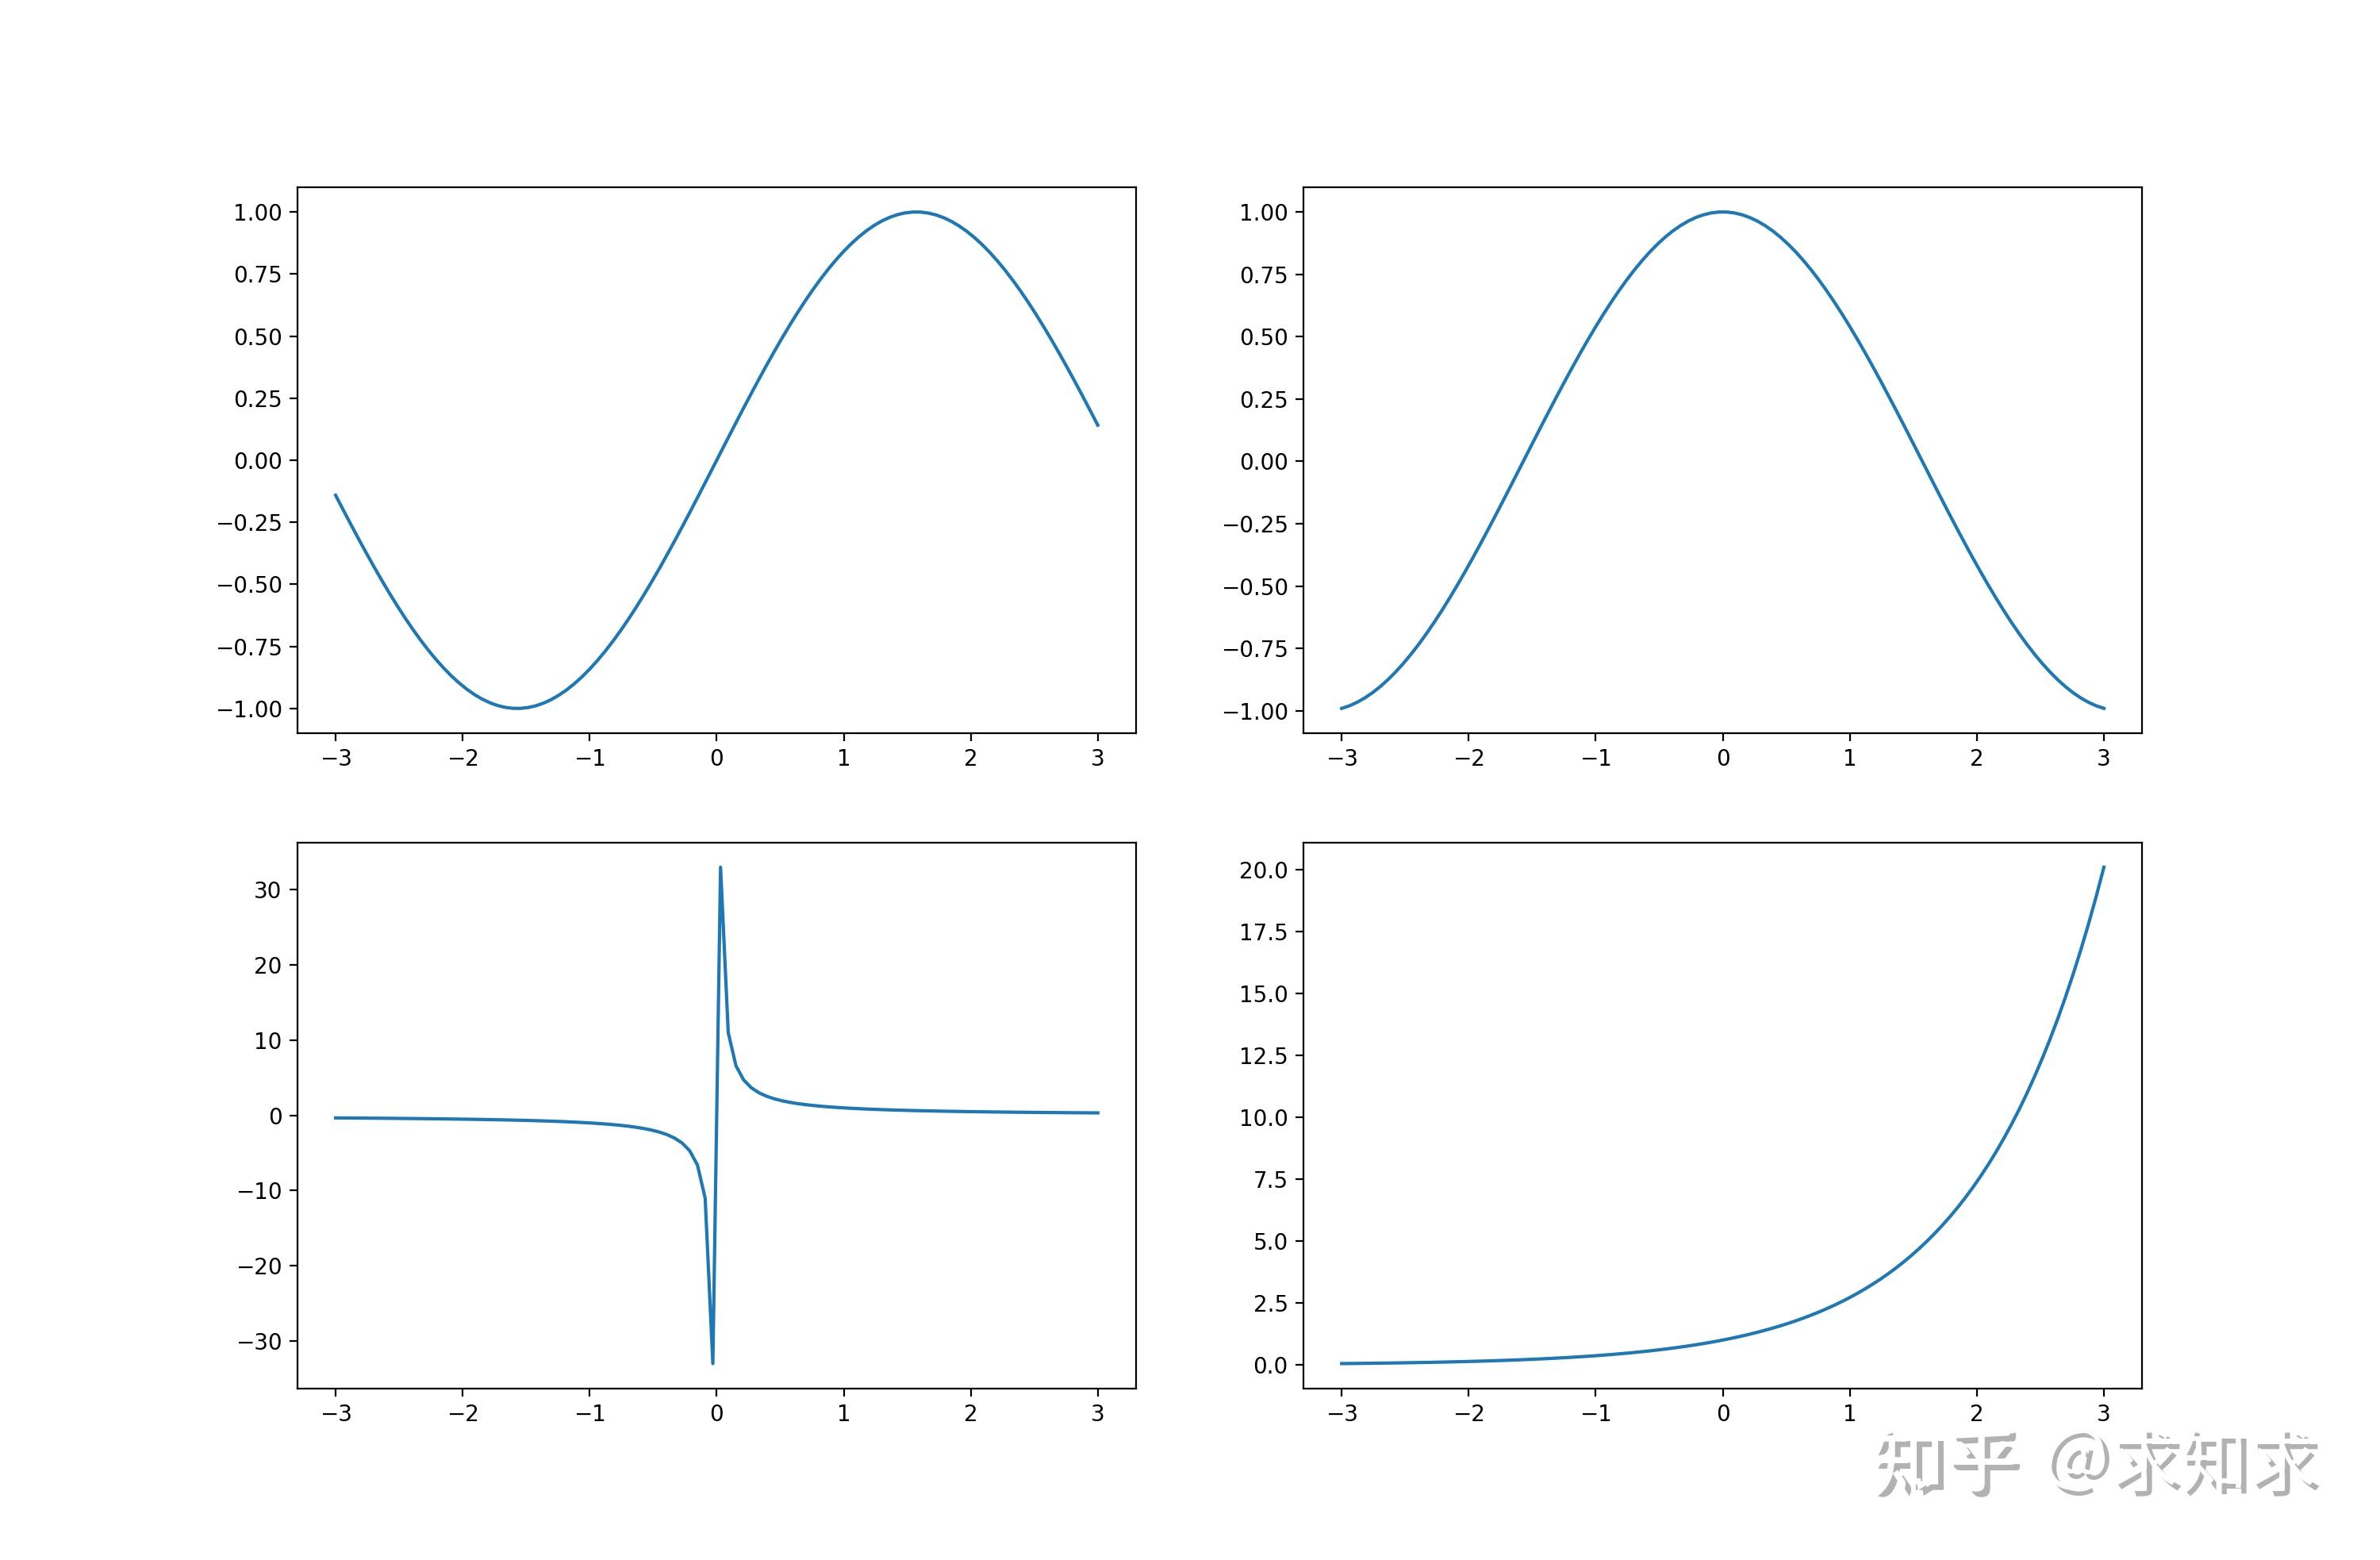 4.设置曲线颜色和图例 ax[0, 0].plot(x, y1, color = 'red', label='A') ax[0, 0].legend() ax[0, 1].plot(x, y2, color = 'blue', label = 'B') ax[0, 1].legend() ax[1, 0].plot(x, y3, color = 'yellow', label = 'C') ax[1, 0].legend() ax[1, 1].plot(x,y4,color = 'pink', label = 'D') ax[1, 1].legend() 5.根据需要可以更改图例的位置,目前有两种办法可以提供图例位置修改 ax[0, 0].legend(loc = 4)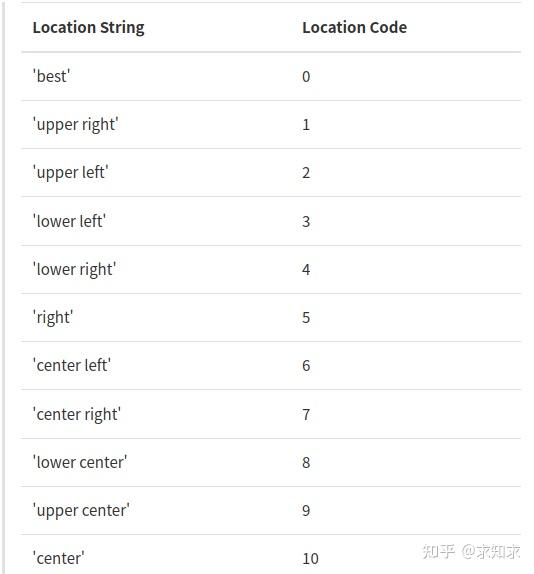  ax[0, 0].legend(bbox_to_anchor=(1.1,1.1)) ax[0, 0].legend(bbox_to_anchor=(1.1,1.1)) 这个方法可以让图例不在子图内,bbox_to_anchor的两个参数分别代表图例x的偏移量和y的偏移量 6.设置子图的小标题、轴范围、轴刻度、轴名称 ## 设置小标题 ax[0, 0].set_title('sin(x)') ## 设置x轴范围 ax[0, 0].set_xlim(-2.5, 2.5) ## 自定义x轴刻度 ax[0, 0].xaxis.set_ticks([-2.5, -1.0, 1.0, 2.5]) ## 隐藏x轴刻度值 ax[0, 0].xaxis.set_ticks([]) ## 设置轴刻度大小 ## 第一个方法设置不了z轴刻度的大小 plt.xticks(fontsize=20) ## 下面两个方法可以设置z轴刻度大小 plt.setp(ax.get_xticklabels(),fontsize=20) ax.tick_params(axis='x', labelsize=20 ) ## 设置轴名称 ax[0, 0].set_xlabel('Steps',fontsize = 12, family = 'Arial') ax[0, 0].set_ylabel('Value',fontsize = 12, family = 'Arial')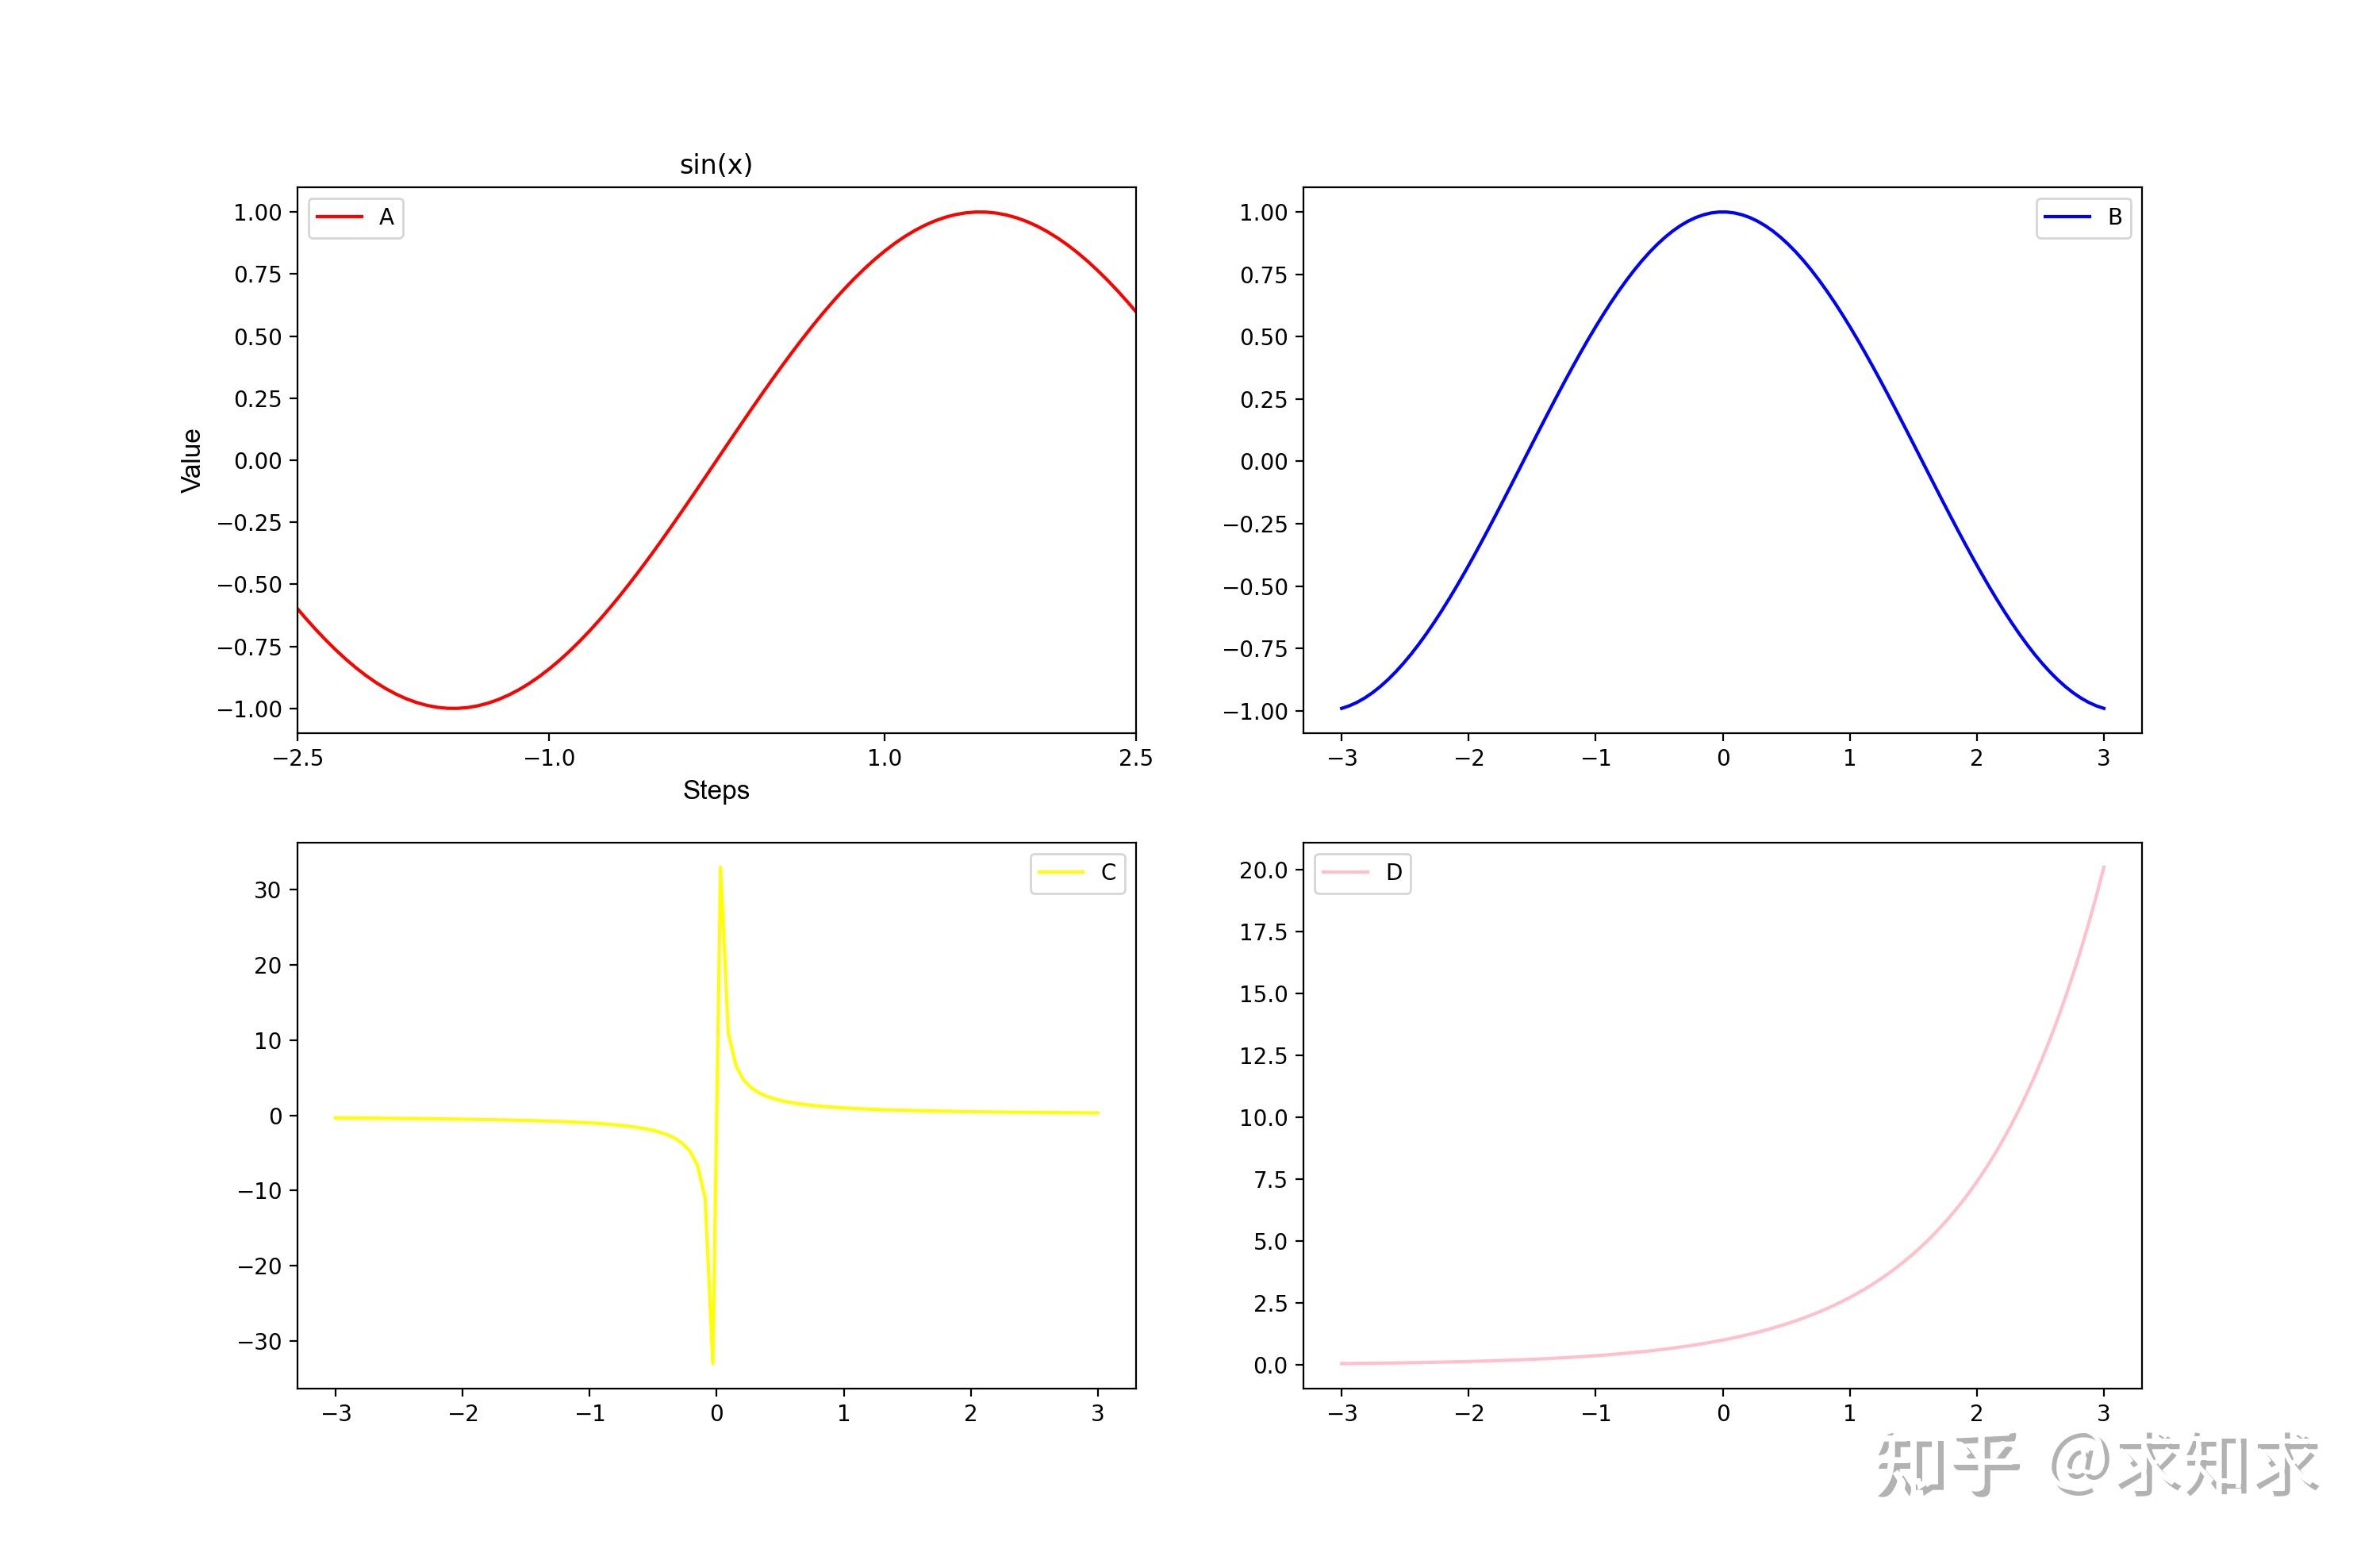 7. 设置所有子图的大标题和大标题所在的相对位置 fig.suptitle('average_reward', x= 0.5, y=0.92, fontsize = 20)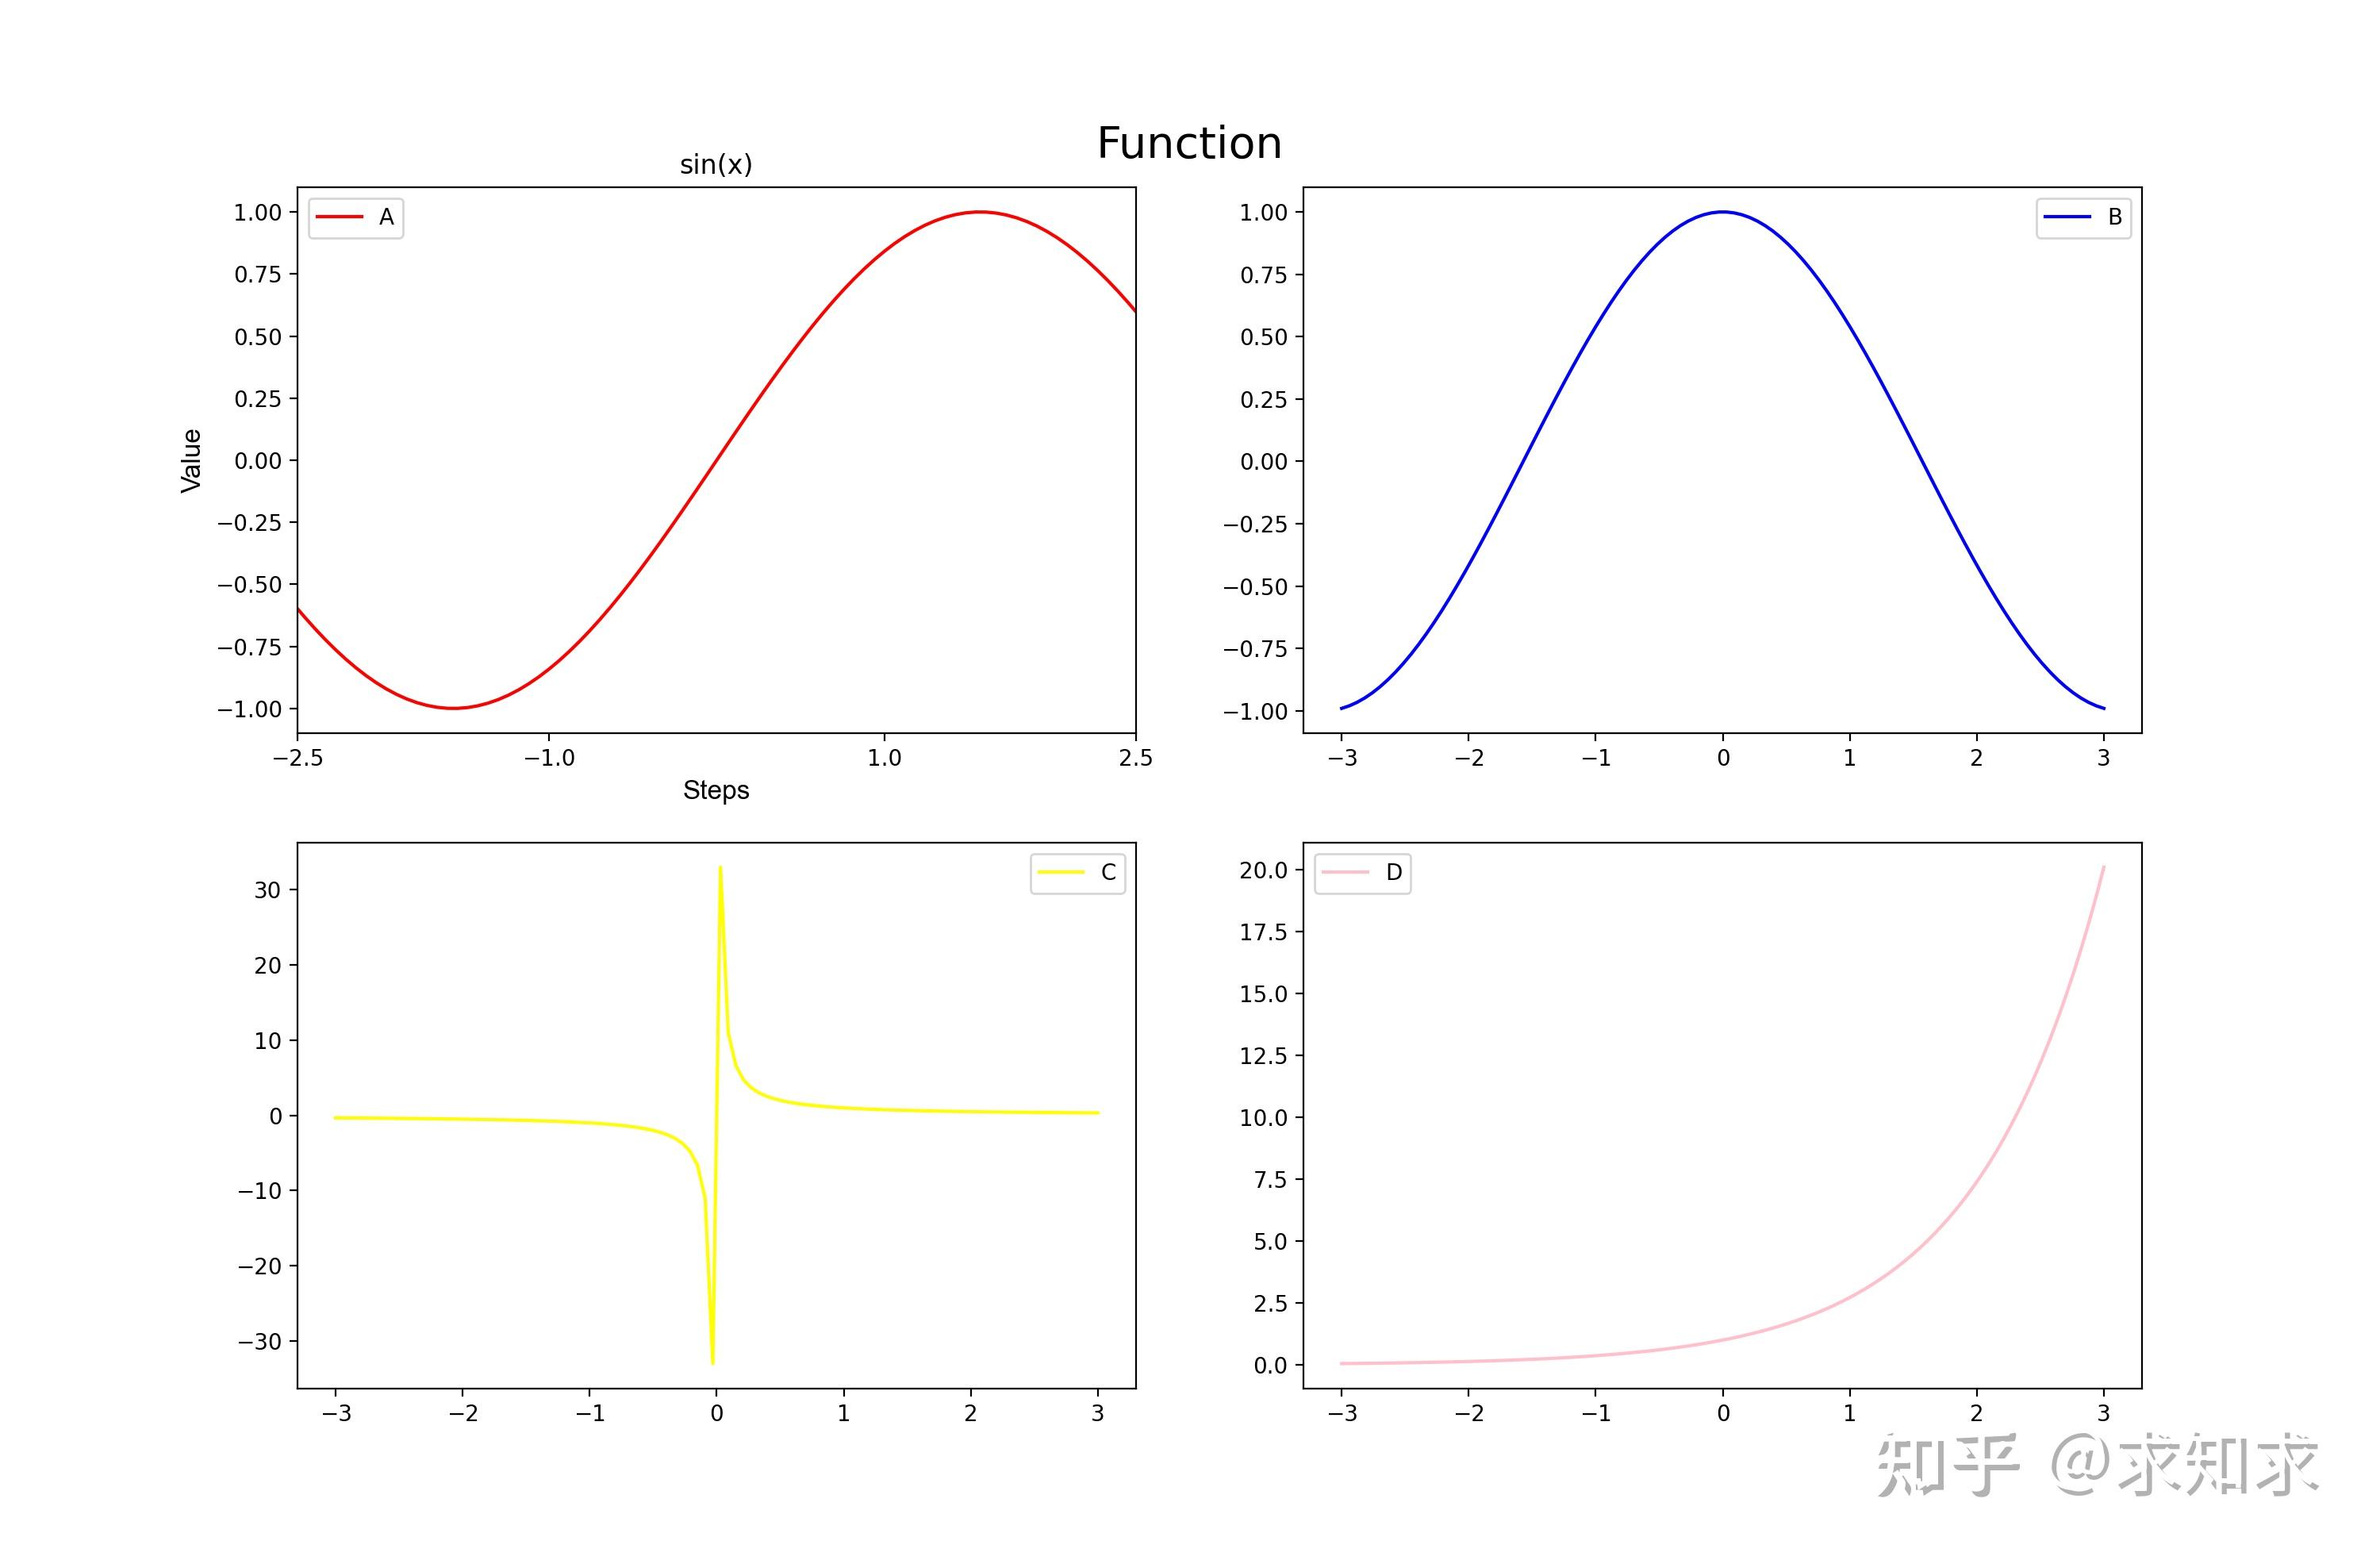 8.如果子图之间发生拥挤,可以调用 fig.tight_layout()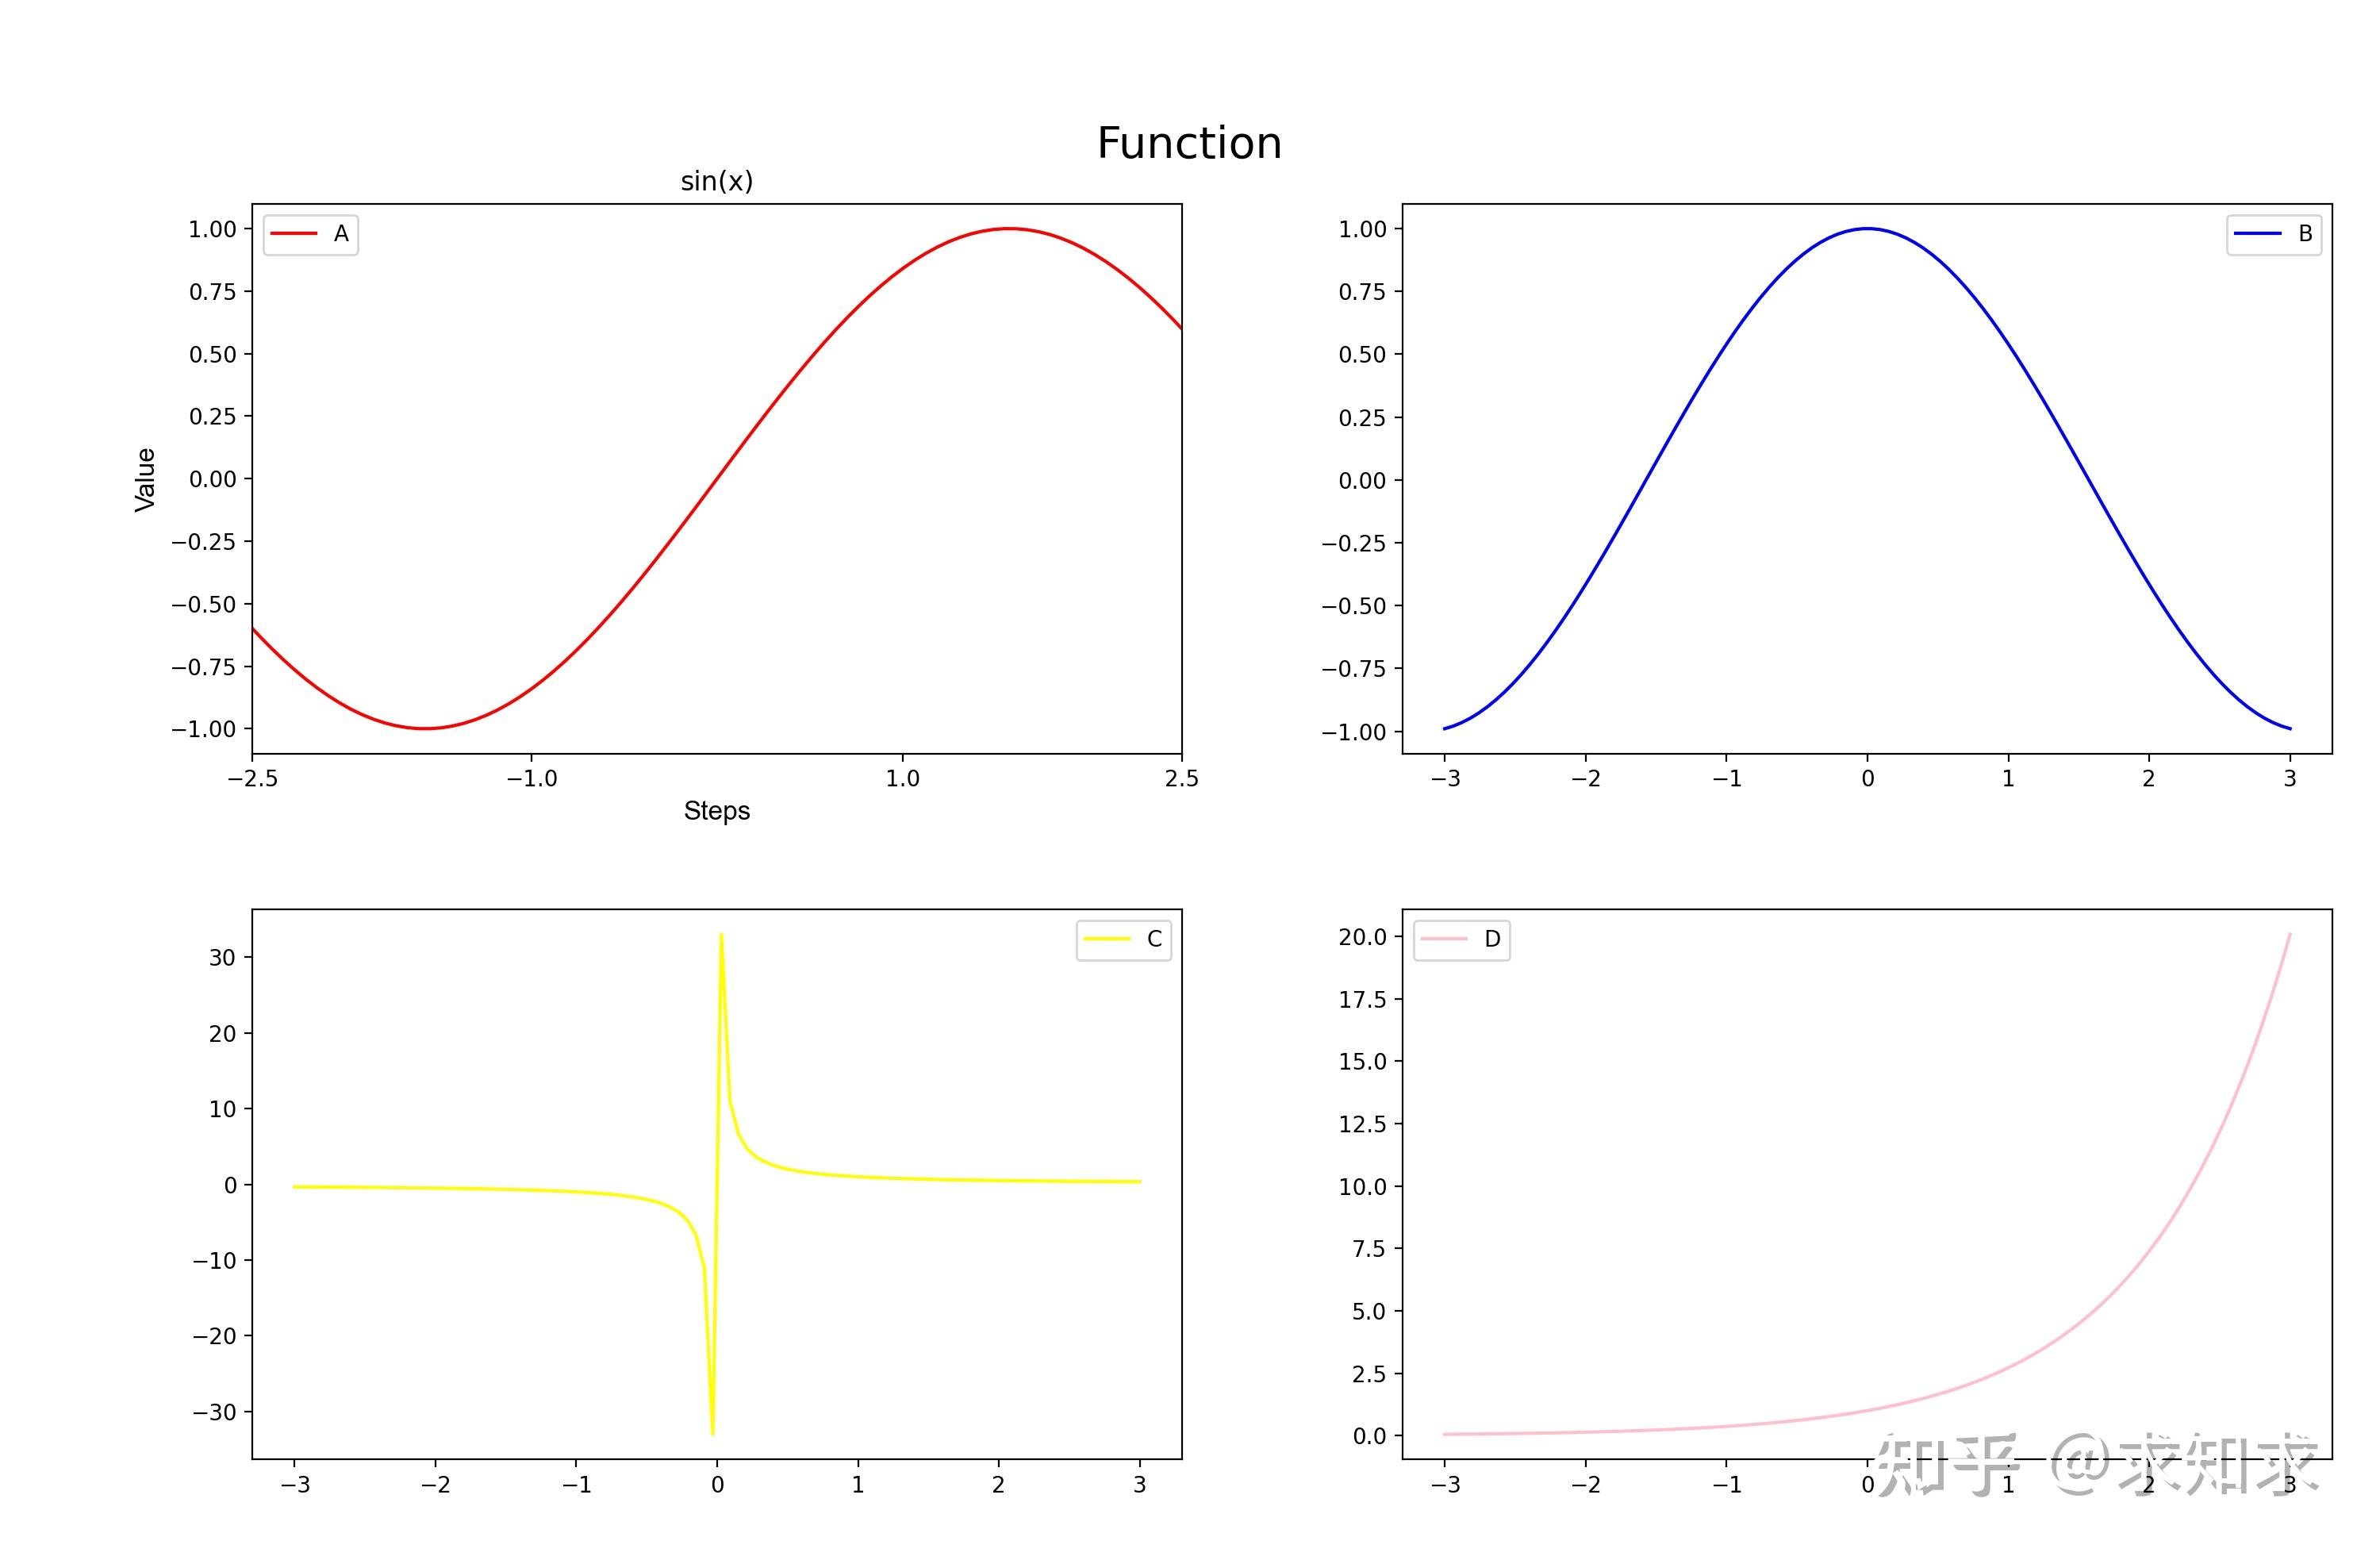 更多详细的用法大家可以参考matplotlib.pyplot文档 https://matplotlib.org/3.5.1/api/_as_gen/matplotlib.pyplot.html |
【本文地址】
公司简介
联系我们