| python中plot画图横坐标为字符串的处理 | 您所在的位置:网站首页 › plot函数python横坐标 › python中plot画图横坐标为字符串的处理 |
python中plot画图横坐标为字符串的处理
|
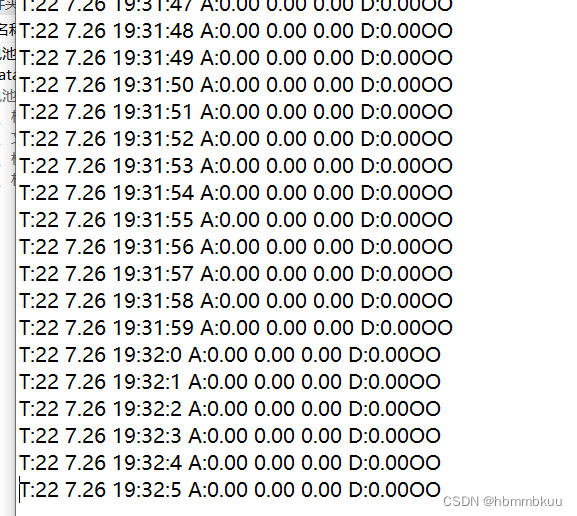
昨天使用plot画图,遇到了一个小问题:数据横坐标为标准的时间格式,如下图第三列:
处理后属于字符串类型(“19:31:48”),故在plot作图时有些困难,查阅资料后发现可以使用两段代码解决 x=range(len(time1)) plt.xticks(x, time1, rotation=45)其中,设置x或y轴对应显示的标签:xticks(ticks=None, labels=None, **kwargs) ticks : array_like,应当放置刻度的位置列表,可以传递一个空列表来禁用xticks labels :array_like, 放置在给定* locs *处的显式标签的列表。 **kwargs:Text属性可以用来控制标签的外观。 plt.xticks()官方给出的例子是: xticks( arange(5), (‘Tom’, ‘Dick’, ‘Harry’, ‘Sally’, ‘Sue’) ) 用’Tom’, ‘Dick’, ‘Harry’, ‘Sally’, 'Sue’作为[0,1,2,3,4]位置显示的label;rotation指的是label的旋转角度。 将上图中的数据存入csv文件后逐一作图的完整代码如下: from email import header import matplotlib.pyplot as plt import numpy as np import pandas as pd import csv ang1=[] ang2=[] ang3=[] deep=[] time1=[] time2=[] with open(r'C:\Users.csv','w',newline='') as f:#写入的csv文件地址 #防止csv文件写入后出现空行,加入newline='' header=["time1","time2","time3","ang1","ang2","ang3","deep"]#csv表头 f_csv=csv.writer(f) f_csv.writerow(header) #逐行读取 for line in open(r'C:\Users\data.txt', 'r'):#读取的txt文件 #处理不必要的字符 new_line = line.strip("\n").split() new_line[0]=new_line[0].replace("T:",'') new_line[3]=new_line[3].replace("A:",'') new_line[6]=new_line[6].replace("D:",'') new_line[6]=new_line[6].replace("OO",'') # print(new_line) f_csv.writerow(new_line) #写入列表 time1.append(new_line[2]) ang1.append(float(new_line[3])) ang2.append(float(new_line[4])) ang3.append(float(new_line[5])) deep.append(float(new_line[6])) #逐一画图 x=range(len(time1)) plt.figure(1) plt.plot(x, ang1,'bo-') plt.xticks(x, time1, rotation=45) plt.xlabel(new_line[1]) plt.figure(2) plt.plot(x, ang2, 'bo-' ) plt.xticks(x, time1, rotation=45) plt.xlabel(new_line[1]) plt.figure(3) plt.plot(x, ang3,'bo-' ) plt.xticks(x, time1, rotation=45) plt.xlabel(new_line[1]) plt.figure(4) plt.plot(x, deep,'bo-' ) plt.xticks(x, time1, rotation=45) plt.xlabel(new_line[1]) plt.legend() plt.show()
|
【本文地址】
公司简介
联系我们