| python 用 matplotlib 饼图参数详解 plt.pie() | 您所在的位置:网站首页 › matplotlib添加图名 › python 用 matplotlib 饼图参数详解 plt.pie() |
python 用 matplotlib 饼图参数详解 plt.pie()
|
1、加载库 import numpy as np import pandas as pd import matplotlib as mpl import matplotlib.pyplot as plt
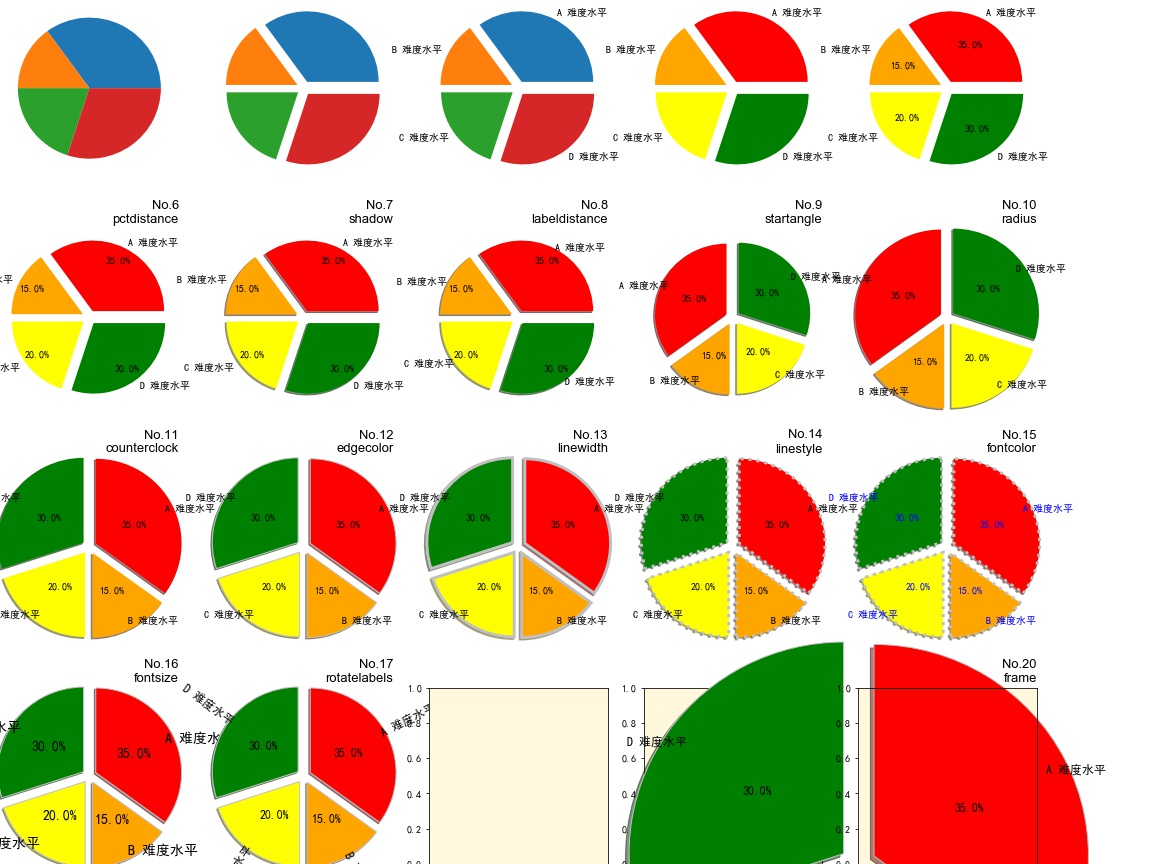
2、逐步添加参数,查看绘图效果 def ax_set_title(s): ax.set_title(label=f'No.{i+1}\n'+s, # 标题的文本内容 loc='right', # 标题的位置 family='Arial', # 标题文本的字体类型 size=13, # 字体大小 ) # 配置字体,显示中文 mpl.rcParams['font.sans-serif'] = ['SimHei'] # 配置坐标轴刻度值模式,显示负号 mpl.rcParams['axes.unicode_minus'] = False # 定义数据 cnt_pct = [0.35, 0.15, 0.20, 0.30] cs = ['red', 'orange', 'yellow', 'green'] labs = [f'{e.upper()} 难度水平' for e in 'abcd'] explode = (0.1, 0.1, 0.1, 0.1) # 初始化图表区 fig, axes = plt.subplots(nrows=4, ncols=5, figsize=(16, 12), facecolor='cornsilk' ) axes = axes.ravel() # 选择子区 1 i = 0 ax = axes[i] ## 绘制饼图 ax.pie(x=cnt_pct, # 产生锲形块的数据 ) ## 设置标题 ax_set_title(s='x') # 选择子区 2 i = 1 ax = axes[i] ## 绘制饼图 ax.pie(x=cnt_pct, # 产生锲形块的数据 explode=explode, # 锲形块分离距离序列 ) ## 设置标题 ax_set_title(s='explode') # 选择子区 3 i = 2 ax = axes[i] ## 绘制饼图 ax.pie(x=cnt_pct, # 产生锲形块的数据 explode=explode, # 锲形块分离距离序列 labels=labs, # 锲形块标签列表 ) ## 设置标题 ax_set_title(s='labels') # 选择子区 4 i = 3 ax = axes[i] ## 绘制饼图 ax.pie(x=cnt_pct, # 产生锲形块的数据 explode=explode, # 锲形块分离距离序列 labels=labs, # 锲形块标签列表 colors=cs, # 锲形块的颜色列表 ) ## 设置标题 ax_set_title(s='colors') ## 设置标题 ax_set_title(s='labels') # 选择子区 5 i = 4 ax = axes[i] ## 绘制饼图 ax.pie(x=cnt_pct, # 产生锲形块的数据 explode=explode, # 锲形块分离距离序列 labels=labs, # 锲形块标签列表 colors=cs, # 锲形块的颜色列表 autopct='%3.1f%%', # 锲形块的数据标注格式 (88.8%) ) ## 设置标题 ax_set_title(s='autopct') # 选择子区 6 i = 5 ax = axes[i] ## 绘制饼图 ax.pie(x=cnt_pct, # 产生锲形块的数据 explode=explode, # 锲形块分离距离序列 labels=labs, # 锲形块标签列表 colors=cs, # 锲形块的颜色列表 autopct='%3.1f%%', # 锲形块的数据标注格式 (88.8%) pctdistance=0.8, # 锲形块数据标注的径向距离 ) ## 设置标题 ax_set_title(s='pctdistance') # 选择子区 7 i = 6 ax = axes[i] ## 绘制饼图 ax.pie(x=cnt_pct, # 产生锲形块的数据 explode=explode, # 锲形块分离距离序列 labels=labs, # 锲形块标签列表 colors=cs, # 锲形块的颜色列表 autopct='%3.1f%%', # 锲形块的数据标注格式 (88.8%) pctdistance=0.8, # 锲形块数据标注的径向距离 shadow=True, ) ## 设置标题 ax_set_title(s='shadow') # 选择子区 8 i = 7 ax = axes[i] ## 绘制饼图 ax.pie(x=cnt_pct, # 产生锲形块的数据 explode=explode, # 锲形块分离距离序列 labels=labs, # 锲形块标签列表 colors=cs, # 锲形块的颜色列表 autopct='%3.1f%%', # 锲形块的数据标注格式 (88.8%) pctdistance=0.8, # 锲形块数据标注的径向距离 shadow=True, labeldistance=1.02, # 锲形块标签的径向距离 ) ## 设置标题 ax_set_title(s='labeldistance') # 选择子区 9 i = 8 ax = axes[i] ## 绘制饼图 ax.pie(x=cnt_pct, # 产生锲形块的数据 explode=explode, # 锲形块分离距离序列 labels=labs, # 锲形块标签列表 colors=cs, # 锲形块的颜色列表 autopct='%3.1f%%', # 锲形块的数据标注格式 (88.8%) pctdistance=0.5, # 锲形块数据标注的径向距离 shadow=True, labeldistance=0.9, # 锲形块标签的径向距离 startangle=90, # 饼图的初始摆放角度 ) ## 设置标题 ax_set_title(s='startangle') # 选择子区 10 i = 9 ax = axes[i] ## 绘制饼图 ax.pie(x=cnt_pct, # 产生锲形块的数据 explode=explode, # 锲形块分离距离序列 labels=labs, # 锲形块标签列表 colors=cs, # 锲形块的颜色列表 autopct='%3.1f%%', # 锲形块的数据标注格式 (88.8%) pctdistance=0.5, # 锲形块数据标注的径向距离 shadow=True, labeldistance=0.9, # 锲形块标签的径向距离 startangle=90, # 饼图的初始摆放角度 radius=1.2, # 饼图半径 ) ## 设置标题 ax_set_title(s='radius') # 选择子区 11 i = 10 ax = axes[i] ## 绘制饼图 ax.pie(x=cnt_pct, # 产生锲形块的数据 explode=explode, # 锲形块分离距离序列 labels=labs, # 锲形块标签列表 colors=cs, # 锲形块的颜色列表 autopct='%3.1f%%', # 锲形块的数据标注格式 (88.8%) pctdistance=0.5, # 锲形块数据标注的径向距离 shadow=True, labeldistance=0.9, # 锲形块标签的径向距离 startangle=90, # 饼图的初始摆放角度 radius=1.2, # 饼图半径 counterclock=False, # 是否让饼图按逆时针顺序呈现 ) ## 设置标题 ax_set_title(s='counterclock') # 选择子区 12 i = 11 ax = axes[i] ## 绘制饼图 ax.pie(x=cnt_pct, # 产生锲形块的数据 explode=explode, # 锲形块分离距离序列 labels=labs, # 锲形块标签列表 colors=cs, # 锲形块的颜色列表 autopct='%3.1f%%', # 锲形块的数据标注格式 (88.8%) pctdistance=0.5, # 锲形块数据标注的径向距离 shadow=True, labeldistance=0.9, # 锲形块标签的径向距离 startangle=90, # 饼图的初始摆放角度 radius=1.2, # 饼图半径 counterclock=False, # 是否让饼图按逆时针顺序呈现 # 锲形块边界属性字典 wedgeprops={'edgecolor': 'silver',} ) ## 设置标题 ax_set_title(s='edgecolor') # 选择子区 13 i = 12 ax = axes[i] ## 绘制饼图 ax.pie(x=cnt_pct, # 产生锲形块的数据 explode=explode, # 锲形块分离距离序列 labels=labs, # 锲形块标签列表 colors=cs, # 锲形块的颜色列表 autopct='%3.1f%%', # 锲形块的数据标注格式 (88.8%) pctdistance=0.5, # 锲形块数据标注的径向距离 shadow=True, labeldistance=0.9, # 锲形块标签的径向距离 startangle=90, # 饼图的初始摆放角度 radius=1.2, # 饼图半径 counterclock=False, # 是否让饼图按逆时针顺序呈现 # 锲形块边界属性字典 wedgeprops={'edgecolor': 'silver', 'linewidth': 3, } ) ## 设置标题 ax_set_title(s='linewidth') # 选择子区 14 i = 13 ax = axes[i] ## 绘制饼图 ax.pie(x=cnt_pct, # 产生锲形块的数据 explode=explode, # 锲形块分离距离序列 labels=labs, # 锲形块标签列表 colors=cs, # 锲形块的颜色列表 autopct='%3.1f%%', # 锲形块的数据标注格式 (88.8%) pctdistance=0.5, # 锲形块数据标注的径向距离 shadow=True, labeldistance=0.9, # 锲形块标签的径向距离 startangle=90, # 饼图的初始摆放角度 radius=1.2, # 饼图半径 counterclock=False, # 是否让饼图按逆时针顺序呈现 # 锲形块边界属性字典 wedgeprops={'edgecolor': 'silver', 'linewidth': 3, 'linestyle': ':' } ) ## 设置标题 ax_set_title(s='linestyle') # 选择子区 15 i = 14 ax = axes[i] ## 绘制饼图 ax.pie(x=cnt_pct, # 产生锲形块的数据 explode=explode, # 锲形块分离距离序列 labels=labs, # 锲形块标签列表 colors=cs, # 锲形块的颜色列表 autopct='%3.1f%%', # 锲形块的数据标注格式 (88.8%) pctdistance=0.5, # 锲形块数据标注的径向距离 shadow=True, labeldistance=0.9, # 锲形块标签的径向距离 startangle=90, # 饼图的初始摆放角度 radius=1.2, # 饼图半径 counterclock=False, # 是否让饼图按逆时针顺序呈现 # 锲形块边界属性字典 wedgeprops={'edgecolor': 'silver', 'linewidth': 3, 'linestyle': ':' }, # 锲形块标签文本和数据标注文本的字体属性 textprops=dict(color='blue') # 字体颜色 ) ## 设置标题 ax_set_title(s='fontcolor') # 选择子区 16 i = 15 ax = axes[i] ## 绘制饼图 ax.pie(x=cnt_pct, # 产生锲形块的数据 explode=explode, # 锲形块分离距离序列 labels=labs, # 锲形块标签列表 colors=cs, # 锲形块的颜色列表 autopct='%3.1f%%', # 锲形块的数据标注格式 (88.8%) pctdistance=0.5, # 锲形块数据标注的径向距离 shadow=True, labeldistance=0.9, # 锲形块标签的径向距离 startangle=90, # 饼图的初始摆放角度 radius=1.2, # 饼图半径 counterclock=False, # 是否让饼图按逆时针顺序呈现 # 锲形块边界属性字典 wedgeprops={'edgecolor': 'silver', 'linewidth': 1, 'linestyle': '-' }, # 锲形块标签文本和数据标注文本的字体属性 textprops=dict(color='k', # 字体颜色 fontsize=14, ) ) ## 设置标题 ax_set_title(s='fontsize') # 选择子区 17 i = 16 ax = axes[i] ## 绘制饼图 ax.pie(x=cnt_pct, # 产生锲形块的数据 explode=explode, # 锲形块分离距离序列 labels=labs, # 锲形块标签列表 colors=cs, # 锲形块的颜色列表 autopct='%3.1f%%', # 锲形块的数据标注格式 (88.8%) pctdistance=0.5, # 锲形块数据标注的径向距离 shadow=True, labeldistance=0.9, # 锲形块标签的径向距离 startangle=90, # 饼图的初始摆放角度 radius=1.2, # 饼图半径 counterclock=False, # 是否让饼图按逆时针顺序呈现 # 锲形块边界属性字典 wedgeprops={'edgecolor': 'silver', 'linewidth': 1, 'linestyle': '-' }, # 锲形块标签文本和数据标注文本的字体属性 textprops=dict(color='k', # 字体颜色 fontsize=12, ), rotatelabels=True # 是否旋转锲形块的标签与其角度对应 ) ## 设置标题 ax_set_title(s='rotatelabels') # 选择子区 18 i = 17 ax = axes[i] ## 设置子区背景色 ax.set_facecolor('cornsilk') # 选择子区 19 i = 18 ax = axes[i] ## 设置子区背景色 ax.set_facecolor('cornsilk') # 选择子区 20 i = 19 ax = axes[i] ## 绘制饼图 ax.pie(x=cnt_pct, # 产生锲形块的数据 explode=explode, # 锲形块分离距离序列 labels=labs, # 锲形块标签列表 colors=cs, # 锲形块的颜色列表 autopct='%3.1f%%', # 锲形块的数据标注格式 (88.8%) pctdistance=0.5, # 锲形块数据标注的径向距离 shadow=True, labeldistance=0.9, # 锲形块标签的径向距离 startangle=90, # 饼图的初始摆放角度 radius=1.2, # 饼图半径 counterclock=False, # 是否让饼图按逆时针顺序呈现 # 锲形块边界属性字典 wedgeprops={'edgecolor': 'silver', 'linewidth': 1, 'linestyle': '-' }, # 锲形块标签文本和数据标注文本的字体属性 textprops=dict(color='k', # 字体颜色 fontsize=12, ), frame=True, # 是否绘制框架 rotatelabels=False # 是否旋转锲形块的标签与其角度对应 ) ## 设置标题 ax_set_title(s='frame') ## 设置子区背景色 ax.set_facecolor('cornsilk') # 设置整个子区的布局 fig.subplots_adjust(left=0, bottom=0, right=0.9, top=1, wspace=0.2, # 子区间空白区域的宽度的归一化值 hspace=0.3); # 子区间空白区域的高度的归一化值 plt.savefig('pie.jpg')图形:
|
【本文地址】
公司简介
联系我们