| 常规、LFM、相位编码、频率编码等雷达调制信号代码(MATLAB) | 您所在的位置:网站首页 › matlab脉冲函数程序 › 常规、LFM、相位编码、频率编码等雷达调制信号代码(MATLAB) |
常规、LFM、相位编码、频率编码等雷达调制信号代码(MATLAB)
|
介绍
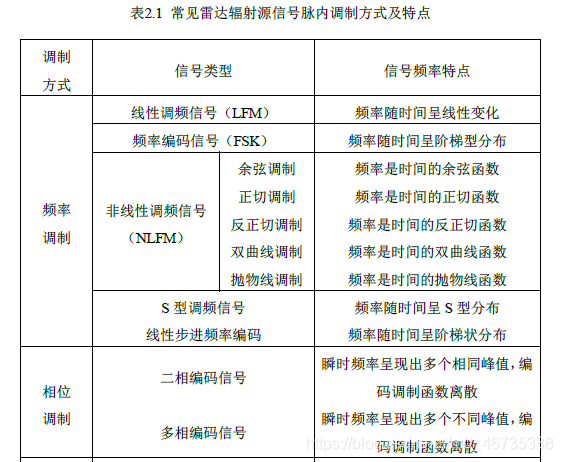
有关傅里叶变化介绍的优秀博文:点这里真的超级有惊喜 雷达信号调制种类:
参考博文: 博文1 博文2 优秀博文:主要参考 matlab代码: 加高斯白噪声:awgn(x,SNR) clc clear all close all fs = 300;%采样率 T = 1/fs; N = 600; t = (0:N-1)*T; % 时间序列 A_danpin = 10; f_danpin = 80; y_danpin = A_danpin*cos(2*pi*f_danpin*t) %y_danpin_noise = y_danpin + randn(size(t)); %添加噪声 y_danpin_noise = awgn(y_danpin ,2);%添加高斯白噪声 figure(1); subplot(2,1,1) %plot(t,y_danpin_noise) plot(t,y_danpin_noise); xlabel('t/s') ylabel('幅度 / V') n = 2^nextpow2(N);%采样点数,采样点数越大,分辨的频率越精确,N>=L,超出的部分信号补为0 Y = fft(y_danpin_noise,n)/n*2;%除以N乘以2才是真实幅值,N越大,幅值精度越高 f = fs/n*(0:1:n-1); %频率 P = abs(Y);%幅值 subplot(2,1,2) plot(f(1:n/2),P(1:n/2));%函数fft返回值的数据结构具有对称性,因此我们只取前一半 xlabel('频率(Hz)') ylabel('幅值 ') title('幅值频谱') grid on;
优秀博文:点这里有惊喜 主要参考:点这里有惊喜
LFM频谱: clc clear all close all B = 2e8; T = 1e-6;%采样时间 fs = 4*B;%采样率 K = B/T; N = round( T / (1/fs) );%采样点数 t = linspace( -T/2 , T/2 , N);%选取采样点 % 线性调频信号 s(t)=a(t)cos[2πf0 t+πkt^2],a(t)是包络,f0是调频频率 A_lfm = 10; f_lfm = 1000; %y_lfm = A_lfm*cos(2*pi*f_lfm*t+pi*K*t.^2); y_lfm = A_lfm*exp(1j*(2*pi*f_lfm*t+pi*K*t.^2)); y_lfm_noise = awgn(y_lfm ,2);%添加高斯白噪声 figure(2) subplot(3,1,1) plot(1e6*t,real(y_lfm_noise)); xlabel('t/us'); title('线性调频信号实部波形'); subplot(3,1,2) plot(1e6*t,imag(y_lfm_noise)); xlabel('t/us'); title('线性调频信号虚部波形'); subplot(3,1,3) freq = linspace(-fs/2,fs/2,N);%频域采样 Sf = fftshift( fft(y_lfm_noise) ); plot( freq/1e6,abs(Sf) ); xlabel('f/MHz'); title('线性调频信号频谱');
参考博文:点这里有惊喜 fs=2000; %采样频率2000MHz=2GHz dt=1/fs; %时间精度us timestart=0; timeend=0.3;%时间us t=(0:(timeend-timestart)/dt-1)*dt+timestart; L=length(t);%600个采样点 f_c = 200 %单位MHz; f_m = 20; %单位MHz; k_f = 20; %调频灵敏度 A_m = sqrt(2); %设置调制信号 mt = cos(2*pi*f_m*t); %设置载频信号 ct = cos(2*pi*f_c*t); %积分 int_mt(1) = 0; for i=1:L-1 int_mt(i+1) = int_mt(i)+mt(i)*dt; end z = A_m*cos(2*pi*f_c*t+2*pi*k_f*int_mt); figure() subplot(2,1,1) plot(t,z);hold on; plot(t,mt,'r--'); xlabel('t/us'); ylabel('幅度/V') title('非线性余弦调制时域波形'); Y = fft(z,L)/L*2;%除以N乘以2才是真实幅值,N越大,幅值精度越高 f = fs/L*(0:1:L-1); %频率 P = abs(Y);%幅值 subplot(2,1,2) plot(f(1:L/2),P(1:L/2));%函数fft返回值的数据结构具有对称性,因此我们只取前一半 xlabel('f/MHz'); ylabel('幅度') title('非线性余弦调制频域波形');
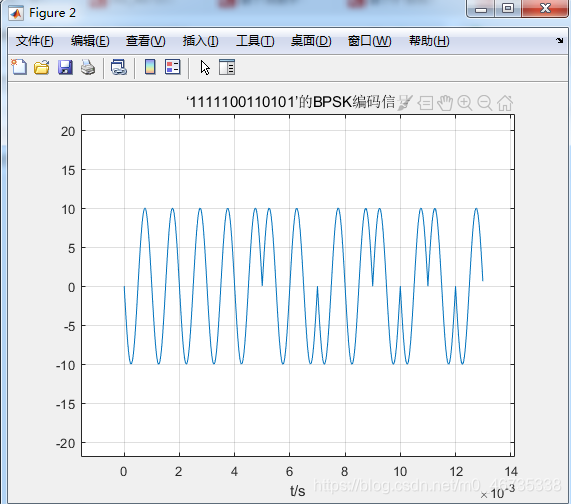
BPSK(二相)、Frank、P1-P4及T1~T4(多相) 关于多相编码具体介绍:点这里有惊喜 关于四相编码具体介绍:点这里有惊喜 (1)BPSK(13位巴克码代码)
(2)四相编码(13位的代码)
(1)二频编码(13位巴克码) clc clear all close all T = 1;%采样时间 f = 1e5;%采样率 t = 0:1/f:(T-1/f); % 采样点 n = length(t); % 采样点数 % 二进制相移键控,0到1,1到0,绝对相位控制 binary_code = '1111100110101'; len_code = length(binary_code); len0_code = 0; len1_code = 0; for i=1:len_code tmp0 = str2num(binary_code(i)); if tmp0 == 1 len1_code = len1_code + 1 end if tmp0 == 0 len0_code = len0_code + 1 end end % 一个码元对应的脉冲长度 f0_2f = 1000; % 频率1000Hz,周期1ms f1_2f = 2000; T0_2f = 1/f0_2f; %单个码元持续时间 T1_2f = 1/f1_2f; %单个码元持续时间 A_2f = 10; % 幅值 t0_mayuan = 0:1/f:(T0_2f-1/f); % 一个码元所持续的时间内的采样点时刻 t1_mayuan = 0:1/f:(T1_2f-1/f); % 一个码元所持续的时间内的采样点时刻 y0_mayuan = A_2f*sin(2*pi*f0_2f*t0_mayuan); % 一个码元的波形,用于表示0 y1_mayuan = A_2f*sin(2*pi*f1_2f*t1_mayuan); t_2f = 0:1/f:((T0_2f*len0_code+T1_2f*len1_code)-1/f); y_2f = []; for i=1:len_code tmp = str2num(binary_code(i)); if tmp == 0 y_2f = [y_2f,y0_mayuan]; end if tmp == 1 y_2f = [y_2f,y1_mayuan]; end end figure(2) plot(t_2f,y_2f) grid on; xlabel('t/s'); title('‘11111001101010’的二频编码信号'); axis([0 1e-2 -2*A_2f 2*A_2f]);
(2)四频编码(13位) clc clear all close all T = 1;%采样时间 f = 1e6;%采样率 t = 0:1/f:(T-1/f); % 采样点 n = length(t); % 采样点数 binary_code = '0213030303120'; len_code = length(binary_code); len0_code = 0; len1_code = 0; len2_code = 0; len3_code = 0; for i=1:len_code tmp0 = str2num(binary_code(i)); if tmp0 == 0 len0_code = len0_code + 1 end if tmp0 == 1 len1_code = len1_code + 1 end if tmp0 == 2 len2_code = len2_code + 1 end if tmp0 == 3 len3_code = len3_code + 1 end end % 一个码元对应的脉冲长度 f0_4f = 1000; % 频率1000Hz,周期1ms f1_4f = 2000; f2_4f = 4000; f3_4f = 8000; T0_4f = 2/f0_4f; %单个码元持续时间 T1_4f = 2/f1_4f; %单个码元持续时间 T2_4f = 2/f2_4f; T3_4f = 2/f3_4f; A_4f = 10; % 幅值 t0_mayuan = 0:1/f:(T0_4f-1/f); % 一个码元所持续的时间内的采样点时刻 t1_mayuan = 0:1/f:(T1_4f-1/f); % 一个码元所持续的时间内的采样点时刻 t2_mayuan = 0:1/f:(T2_4f-1/f); % 一个码元所持续的时间内的采样点时刻 t3_mayuan = 0:1/f:(T3_4f-1/f); % 一个码元所持续的时间内的采样点时刻 y0_mayuan = A_4f*sin(2*pi*f0_4f*t0_mayuan); % 一个码元的波形,用于表示0 y1_mayuan = A_4f*sin(2*pi*f1_4f*t1_mayuan); y2_mayuan = A_4f*sin(2*pi*f2_4f*t2_mayuan); y3_mayuan = A_4f*sin(2*pi*f3_4f*t3_mayuan); t_4f = 0:1/f:((T0_4f*len0_code+T1_4f*len1_code+T2_4f*len2_code+T3_4f*len3_code)-1/f); y_4f = []; for i=1:len_code tmp = str2num(binary_code(i)); if tmp == 0 y_4f = [y_4f,y0_mayuan]; end if tmp == 1 y_4f = [y_4f,y1_mayuan]; end if tmp == 2 y_4f = [y_4f,y2_mayuan]; end if tmp == 3 y_4f = [y_4f,y3_mayuan]; end end figure() subplot(2,1,1) plot(t_4f,y_4f) grid on; xlabel('t/s'); title('‘0213030303120’的四频编码信号'); subplot(2,1,2) plot(t_4f,abs(fftshift(fft(y_4f)))); grid on; xlabel('f/Hz'); title('‘0213030303120’的四频编码信号频域图');
|


 注:要使得时域图扩大范围,只需要改变采样点数,比如 t (1:500)【采500个点】可以改成t(1:1000)【采1000个点】。


 与二相编码相比,只是从0,90,180,-90度的相位变化,四种相位分别用0,2,1,3表示。
 问题:相位编码和频率编码的时域波形如何拓展??? 像LFM一样通过改变采样点数。
【本文地址】
公司简介
联系我们