| Matlab绘制箭头坐标轴图形 | 您所在的位置:网站首页 › matlab画图坐标轴 › Matlab绘制箭头坐标轴图形 |
Matlab绘制箭头坐标轴图形
|
1. 原由 Matlab自带绘图函数,坐标轴不带箭头,如下所示: 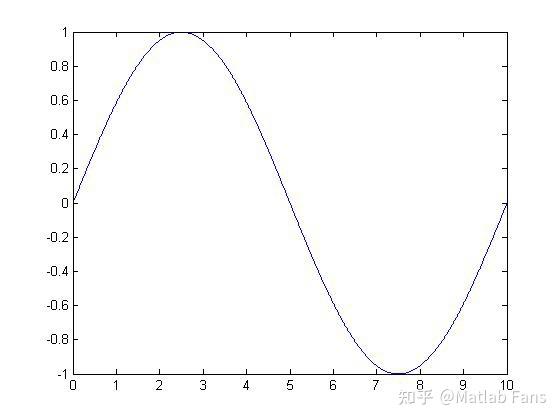 有时需要使用Matlab绘制坐标轴带有箭头的图形,特别是一些原理性的图形,只需要定性表达曲线的变化趋势,无需精确表达曲线的数量关系,此时使用带箭头的坐标轴显得更加美观。  2. 方法 2. 方法使用Matlab自带绘图函数,在生成的图形上叠加两个annotation对象表示x轴和y轴,定义对象位置和样式使其显示为带箭头坐标轴的样子。 3. 函数笔者使用Matlab开发了plot_with_arrow函数包,可实现箭头坐标轴图形的绘制,程序调用格式与系统自带的绘图函数plot等一致,使用起来简单便捷。 function [h, h_a, h_p, h_arrow] = plot_with_arrow( h,x,y,style,pos,plot_fun,Attribute_Set,options ) % [h h_a h_p h_arrow] = plot_with_arrow( h,x,y,style,pos,plot_fun,Attribute_Set,options ) % 画带箭头的图形 % 输入: % h有三种选择: 1. 空数组 [] 生成新figure及axes % 2. 图形句柄 h_figure 新生成axes % 3. 坐标轴句柄 h_axes % x-y为数据对,数据对为[]时,只绘制箭头坐标轴,不绘制曲线,返回值 h_p = [] % style为曲线样式或颜色 % pos用于控制坐标轴的位置 % p 正 n 负 a 全 % 'pp' 坐标轴在第1象限 % 'pa' 坐标轴在第1、4象限 % 'ap' 坐标轴在第1、2象限 % 'aa' 坐标轴在第1、2、3、4象限 % 'n' 表示箭头反向,坐标轴位置位于2、3象限 % 也可在pos中直接输入箭头起始位置坐标,格式为 [X0 Y0 Xi Yi X_y Y_x] % 具体意义见子函数 Arrow_XY % plot_fun 绘图函数,句柄格式,默认为plot % Attribute_Set 为箭头属性,两列元胞数组,第一列为属性名,第二列为属性值 % 也可对返回的箭头句柄h_arrow操作,来设置其属性 % options绘图设置选项,值可为: 选项名 标号 功能 % FixAxesPosition 1 固定坐标轴位置 % CorrectArrowPos_pp 2 校正箭头坐标位置,使其与axes完全贴合 % 返回值 % h 图形句柄 % h_a 坐标轴句柄 % h_p 曲线句柄 % h_arrow 箭头句柄 [h_xa h_ya] 句柄向量 % 测试文件:plot_with_arrow_Test.m4. 演示4.1 当前坐标轴上绘制单位圆%% Test 1: 极简调用方法 t = linspace(0,2*pi,200); x = cos(t); y = sin(t); plot_with_arrow( gca,x,y ); % 在当前坐标轴上绘图 4.2 添加x轴、y轴标签,添加图名%% Test 2: 添加x轴、y轴标签,添加图名
x = linspace(0,10,1000);
y = sin(2*pi*0.1*x);
plot_with_arrow( gca,x,y,'k' ); % 绘图
htext_x = Arrow_Xlabel(gca,'时间/s'); % 添加x轴标签
htext_y = Arrow_Ylabel(gca,'幅值/V'); % 添加y轴标签
htext_title = Arrow_Title(gca,'图形Test'); % 添加图形标题 4.2 添加x轴、y轴标签,添加图名%% Test 2: 添加x轴、y轴标签,添加图名
x = linspace(0,10,1000);
y = sin(2*pi*0.1*x);
plot_with_arrow( gca,x,y,'k' ); % 绘图
htext_x = Arrow_Xlabel(gca,'时间/s'); % 添加x轴标签
htext_y = Arrow_Ylabel(gca,'幅值/V'); % 添加y轴标签
htext_title = Arrow_Title(gca,'图形Test'); % 添加图形标题 4.3 指定坐标轴箭头的位置和方向%% Test 3: 改变坐标轴箭头方向
x = linspace(0,10,1000);
y = sin(2*pi*0.1*x);
h1 = subplot(321);
plot_with_arrow( h1,x,y,'k','pp' ); % 坐标轴在I象限,箭头均为正向
h2 = subplot(322);
plot_with_arrow( h2,x,y,'k','pa' ); % 坐标轴在I、VI象限,箭头均为正向
h3 = subplot(323);
plot_with_arrow( h3,x,y,'k','np' ); % 坐标轴在II象限,x方向为负,y方向为正
h4 = subplot(324);
plot_with_arrow( h4,x,y,'k','aa' ); % 坐标轴在II象限,箭头均为正向
h5 = subplot(325);
plot_with_arrow( h5,x,y,'k','pn' ); % 坐标轴在VI象限,x方向为正,y方向为负
h6 = subplot(326);
plot_with_arrow( h6,x,y,'k','nn' ); % 坐标轴在III象限,箭头均为负向 4.3 指定坐标轴箭头的位置和方向%% Test 3: 改变坐标轴箭头方向
x = linspace(0,10,1000);
y = sin(2*pi*0.1*x);
h1 = subplot(321);
plot_with_arrow( h1,x,y,'k','pp' ); % 坐标轴在I象限,箭头均为正向
h2 = subplot(322);
plot_with_arrow( h2,x,y,'k','pa' ); % 坐标轴在I、VI象限,箭头均为正向
h3 = subplot(323);
plot_with_arrow( h3,x,y,'k','np' ); % 坐标轴在II象限,x方向为负,y方向为正
h4 = subplot(324);
plot_with_arrow( h4,x,y,'k','aa' ); % 坐标轴在II象限,箭头均为正向
h5 = subplot(325);
plot_with_arrow( h5,x,y,'k','pn' ); % 坐标轴在VI象限,x方向为正,y方向为负
h6 = subplot(326);
plot_with_arrow( h6,x,y,'k','nn' ); % 坐标轴在III象限,箭头均为负向 4.4 使用数值指定坐标轴箭头的位置和方向%% Test 4:用数值指示箭头坐标轴位置
x = linspace(0,10,1000);
y = sin(2*pi*0.1*x);
figure
ha1 = subplot(211); % 获取坐标轴句柄
pos = [0.1 0.7 1 1 0.1 0.7]; % 坐标轴位置,格式为 [X0 Y0 Xi Yi X_y Y_x]
plot_with_arrow( ha1,x,y,'k',pos ); % 直接输入坐标轴位置,暂不支持箭头坐标轴位置输入数值情况
ha2 = subplot(212); % 获取坐标轴句柄
pos = [0.8 0.2 0.1 0.6 0.8 0.2]; % 坐标轴位置,格式为 [X0 Y0 Xi Yi X_y Y_x]
plot_with_arrow( ha2,x,y,'k',pos ); % 直接输入坐标轴位置,暂不支持箭头坐标轴位置输入数值情况 4.4 使用数值指定坐标轴箭头的位置和方向%% Test 4:用数值指示箭头坐标轴位置
x = linspace(0,10,1000);
y = sin(2*pi*0.1*x);
figure
ha1 = subplot(211); % 获取坐标轴句柄
pos = [0.1 0.7 1 1 0.1 0.7]; % 坐标轴位置,格式为 [X0 Y0 Xi Yi X_y Y_x]
plot_with_arrow( ha1,x,y,'k',pos ); % 直接输入坐标轴位置,暂不支持箭头坐标轴位置输入数值情况
ha2 = subplot(212); % 获取坐标轴句柄
pos = [0.8 0.2 0.1 0.6 0.8 0.2]; % 坐标轴位置,格式为 [X0 Y0 Xi Yi X_y Y_x]
plot_with_arrow( ha2,x,y,'k',pos ); % 直接输入坐标轴位置,暂不支持箭头坐标轴位置输入数值情况 4.5 使用其它绘图函数%% Test5: 其它绘图函数
x = -2.9:0.2:2.9;
y = exp(-x.*x);
figure
h_a = subplot(211);
plot_with_arrow( h_a,x,y,'r',[],@bar ); % 以bar函数绘直方图
htext_x = Arrow_Xlabel([],'时间/s',[]);
htext_y = Arrow_Ylabel([],'幅值/V',[]);
htext_title = Arrow_Title([],'图形Test1');
h_a2 = subplot(212);
plot_with_arrow( h_a2,x,y,'b',[],@stem ); % 以stem函数画火柴杆图
htext_x = Arrow_Xlabel([],'时间/s',[]);
htext_y = Arrow_Ylabel([],'幅值/V',[]);
htext_title = Arrow_Title([],'图形Test2'); 4.5 使用其它绘图函数%% Test5: 其它绘图函数
x = -2.9:0.2:2.9;
y = exp(-x.*x);
figure
h_a = subplot(211);
plot_with_arrow( h_a,x,y,'r',[],@bar ); % 以bar函数绘直方图
htext_x = Arrow_Xlabel([],'时间/s',[]);
htext_y = Arrow_Ylabel([],'幅值/V',[]);
htext_title = Arrow_Title([],'图形Test1');
h_a2 = subplot(212);
plot_with_arrow( h_a2,x,y,'b',[],@stem ); % 以stem函数画火柴杆图
htext_x = Arrow_Xlabel([],'时间/s',[]);
htext_y = Arrow_Ylabel([],'幅值/V',[]);
htext_title = Arrow_Title([],'图形Test2'); 4.6 绘制光坐标轴,hold on之后再绘制图形%% Test6: 绘制光坐标轴,hold on之后再绘制图形
figure
pos = 'an';
plot_with_arrow([],[],[],[],pos); % 绘制光坐标轴
hold on
t = linspace(0,4*pi,200);
x = sin(t);
y = cos(t);
plot(t,x) % 绘制图形
plot(t,y,'r--') % 绘制图形 4.6 绘制光坐标轴,hold on之后再绘制图形%% Test6: 绘制光坐标轴,hold on之后再绘制图形
figure
pos = 'an';
plot_with_arrow([],[],[],[],pos); % 绘制光坐标轴
hold on
t = linspace(0,4*pi,200);
x = sin(t);
y = cos(t);
plot(t,x) % 绘制图形
plot(t,y,'r--') % 绘制图形 4.7 坐标调整%% Test7: 坐标调整
% 当坐标轴中的子对象(如曲线等)被Label对象挡住时,可通过axis或xlim、ylim调整坐标轴位置来消除这种影响
% 也可通过h_text_x/y句柄或是通过鼠标手动调整Label对象的位置
clc
clear
x = linspace(0,10,1000);
y = sin(2*pi*0.1*x);
figure
h_a1 = subplot(221);
plot_with_arrow( h_a1,x,y,'r','pa' );
htext_x1 = Arrow_Xlabel([],'时间/s','pa');
htext_y1 = Arrow_Ylabel([],'幅值/V','pa');
htext_title1 = Arrow_Title(h_a1,'调整前');
h_a2 = subplot(222);
plot_with_arrow( h_a2,x,y,'b','pa' );
htext_x2 = Arrow_Xlabel([],'时间/s','pa');
htext_y2 = Arrow_Ylabel([],'幅值/V','pa');
htext_title2 = Arrow_Title(h_a2,'调整后');
axes(h_a2) % 使h_a2为当前坐标轴
axis([0 12 -1.5 1.5]) % 调整坐标轴,使Label不干扰图形
h_a3 = subplot(223);
pos3 = 'nn';
plot_with_arrow( h_a3,x,y,'r',pos3 );
htext_x3 = Arrow_Xlabel([],'时间/s',pos3);
htext_y3 = Arrow_Ylabel([],'幅值/V',pos3);
htext_title3 = Arrow_Title(h_a3,'调整前');
h_a4 = subplot(224);
plot_with_arrow( h_a4,x,y,'b',pos3 );
htext_x4 = Arrow_Xlabel([],'时间/s',pos3);
htext_y4 = Arrow_Ylabel([],'幅值/V',pos3);
htext_title4 = Arrow_Title(h_a4,'调整后');
axes(h_a4) % 使h_a4为当前坐标轴
axis([-2 10 -1.5 1]) % 调整坐标轴,使Label不干扰图形 4.7 坐标调整%% Test7: 坐标调整
% 当坐标轴中的子对象(如曲线等)被Label对象挡住时,可通过axis或xlim、ylim调整坐标轴位置来消除这种影响
% 也可通过h_text_x/y句柄或是通过鼠标手动调整Label对象的位置
clc
clear
x = linspace(0,10,1000);
y = sin(2*pi*0.1*x);
figure
h_a1 = subplot(221);
plot_with_arrow( h_a1,x,y,'r','pa' );
htext_x1 = Arrow_Xlabel([],'时间/s','pa');
htext_y1 = Arrow_Ylabel([],'幅值/V','pa');
htext_title1 = Arrow_Title(h_a1,'调整前');
h_a2 = subplot(222);
plot_with_arrow( h_a2,x,y,'b','pa' );
htext_x2 = Arrow_Xlabel([],'时间/s','pa');
htext_y2 = Arrow_Ylabel([],'幅值/V','pa');
htext_title2 = Arrow_Title(h_a2,'调整后');
axes(h_a2) % 使h_a2为当前坐标轴
axis([0 12 -1.5 1.5]) % 调整坐标轴,使Label不干扰图形
h_a3 = subplot(223);
pos3 = 'nn';
plot_with_arrow( h_a3,x,y,'r',pos3 );
htext_x3 = Arrow_Xlabel([],'时间/s',pos3);
htext_y3 = Arrow_Ylabel([],'幅值/V',pos3);
htext_title3 = Arrow_Title(h_a3,'调整前');
h_a4 = subplot(224);
plot_with_arrow( h_a4,x,y,'b',pos3 );
htext_x4 = Arrow_Xlabel([],'时间/s',pos3);
htext_y4 = Arrow_Ylabel([],'幅值/V',pos3);
htext_title4 = Arrow_Title(h_a4,'调整后');
axes(h_a4) % 使h_a4为当前坐标轴
axis([-2 10 -1.5 1]) % 调整坐标轴,使Label不干扰图形 4.8 修改箭头属性%% 修改箭头属性
x = linspace(0,20,1000);
y = sin(2*pi*0.1*x);
h_f = figure;
[h, h_a, h_p, h_arrow] = plot_with_arrow( h_f,x,y,'k' ); % 绘制图形
% 改变颜色
set( h_arrow,'color','r' )
% 修改箭头类型
set( h_arrow,'HeadStyle','vback3' ) 4.8 修改箭头属性%% 修改箭头属性
x = linspace(0,20,1000);
y = sin(2*pi*0.1*x);
h_f = figure;
[h, h_a, h_p, h_arrow] = plot_with_arrow( h_f,x,y,'k' ); % 绘制图形
% 改变颜色
set( h_arrow,'color','r' )
% 修改箭头类型
set( h_arrow,'HeadStyle','vback3' ) 4.9 绘制带箭头图形% 绘制带箭头图形 + 箭头坐标轴
plot_with_arrow([],[],[],[],'aa'); % 使用plot_with_arrow绘制箭头坐标轴
hold on
t = [0:0.01:20];
x = t.*cos(t);
y = t.*sin(t);
arrowPlot(x, y, 'number', 5, 'color', 'r', 'LineWidth', 1, 'scale', 0.8, 'ratio', 'equal'); 4.9 绘制带箭头图形% 绘制带箭头图形 + 箭头坐标轴
plot_with_arrow([],[],[],[],'aa'); % 使用plot_with_arrow绘制箭头坐标轴
hold on
t = [0:0.01:20];
x = t.*cos(t);
y = t.*sin(t);
arrowPlot(x, y, 'number', 5, 'color', 'r', 'LineWidth', 1, 'scale', 0.8, 'ratio', 'equal'); % 绘制带箭头图形 + 箭头坐标轴
plot_with_arrow([],[],[],[],'aa'); % 使用plot_with_arrow绘制箭头坐标轴
hold on
t = linspace(0,2*pi,600);
x = cos(t);
y = sin(t);
plot(x,y,'r') % 绘制直径1圆
plot(3*x,3*y,'r') % 绘制直径3圆
ind = 25 + 0:100:600;
for ii = 1:length(ind) % 循环绘制斜线
hold on
arrowPlot([3*x(ind(ii)) x(ind(ii))], [3*y(ind(ii)) y(ind(ii))], 'number', 2, 'color', 'r');
end
axis equal % 绘制带箭头图形 + 箭头坐标轴
plot_with_arrow([],[],[],[],'aa'); % 使用plot_with_arrow绘制箭头坐标轴
hold on
t = linspace(0,2*pi,600);
x = cos(t);
y = sin(t);
plot(x,y,'r') % 绘制直径1圆
plot(3*x,3*y,'r') % 绘制直径3圆
ind = 25 + 0:100:600;
for ii = 1:length(ind) % 循环绘制斜线
hold on
arrowPlot([3*x(ind(ii)) x(ind(ii))], [3*y(ind(ii)) y(ind(ii))], 'number', 2, 'color', 'r');
end
axis equal 4.10 绘制箭头坐标轴动态图形%% 绘制动态正弦曲线
X = linspace(0,3,200)';
Y = [sin(2*pi*X) cos(2*pi*X) sin(2*pi*X)+cos(2*pi*X) ];
dt = 0.02;
plot_with_arrow([],[],[],[],'aa'); % 使用plot_with_arrow绘制箭头坐标轴
hold on
F = MovieXY(X,Y,dt); % 绘制动态曲线
Fun_F2gif(F,'Test2.gif',0.01); % 生成gif图片 4.10 绘制箭头坐标轴动态图形%% 绘制动态正弦曲线
X = linspace(0,3,200)';
Y = [sin(2*pi*X) cos(2*pi*X) sin(2*pi*X)+cos(2*pi*X) ];
dt = 0.02;
plot_with_arrow([],[],[],[],'aa'); % 使用plot_with_arrow绘制箭头坐标轴
hold on
F = MovieXY(X,Y,dt); % 绘制动态曲线
Fun_F2gif(F,'Test2.gif',0.01); % 生成gif图片 %% 3.A 绘制不同阻尼比二阶系统的动态阶跃响应曲线
T = linspace(0,30,100)';
sys1 = tf(1,[1 0.5 1]); % 阻尼比0.25
sys2 = tf(1,[1 1 1]); % 阻尼比0.5
sys3 = tf(1,[1 2 1]); % 阻尼比1
Y1 = step(sys1,T);
Y2 = step(sys2,T);
Y3 = step(sys3,T);
dt = 0.01;
plot_with_arrow([],[],[],[],'pa'); % 使用plot_with_arrow绘制箭头坐标轴
F = MovieXY(T,[Y1 Y2 Y3],dt,{'*','o','s'}); % 绘制动态曲线
Fun_F2gif(F,'Test3.gif',0.01); % 生成gif图片 %% 3.A 绘制不同阻尼比二阶系统的动态阶跃响应曲线
T = linspace(0,30,100)';
sys1 = tf(1,[1 0.5 1]); % 阻尼比0.25
sys2 = tf(1,[1 1 1]); % 阻尼比0.5
sys3 = tf(1,[1 2 1]); % 阻尼比1
Y1 = step(sys1,T);
Y2 = step(sys2,T);
Y3 = step(sys3,T);
dt = 0.01;
plot_with_arrow([],[],[],[],'pa'); % 使用plot_with_arrow绘制箭头坐标轴
F = MovieXY(T,[Y1 Y2 Y3],dt,{'*','o','s'}); % 绘制动态曲线
Fun_F2gif(F,'Test3.gif',0.01); % 生成gif图片 源程序下载 源程序下载
|
【本文地址】
公司简介
联系我们