|
超详细的gnuplot使用教程
1.gnuplot参数介绍及演示1.1首先来解释一下会用到的各类参数以及其解释1.2 画图实际测试1.3 其它参数介绍(约定范围、坐标轴设定)1.3.1 约束画图范围1.3.2 关于坐标轴的设定1.3.3 图例1.3.4 在图中任意位置插入文字
1.4 同时画出多条曲线1.5 x轴时间设置1.6 在图中添加直线和箭头1.7 读取dat、txt文件进行画图1.8 设定图的大小和位置1.9 画多个图
2.gnuplot进阶2.1 使两坐标轴的单位长度等长2.2 在同一张图里利用左右两边的y轴分别画图2.3画漂亮的pm3D图2.4 画等高线2.5 利用脚本文件避免重复输入2.6 gnuplot画GIF动图
3.参考文章
1.gnuplot参数介绍及演示
1.1首先来解释一下会用到的各类参数以及其解释
命令缩写意义Withwwith后边跟需要指定的样式Linel用线l显示Pointp用点显示LinePointslp用线和点画,对数据绘图时有用LineTypelt线的样式(0代表虚线,1-7代表实线,颜色分别为紫、蓝、绿、橙、黄、靛、红。超过7以后颜色依次循环)LineWidthlw线的宽度(level从0开始,默认为1)PointTypept点的样式(level从0开始,默认为1)PointSizeps点的宽度(level从0开始,默认为1)
1.2 画图实际测试
为了显示出不同的差别,此处我谨以sinx函数或者cos函数来进行显示:
plot sin(x)
//当没有设置其格式时,调用默认的设置

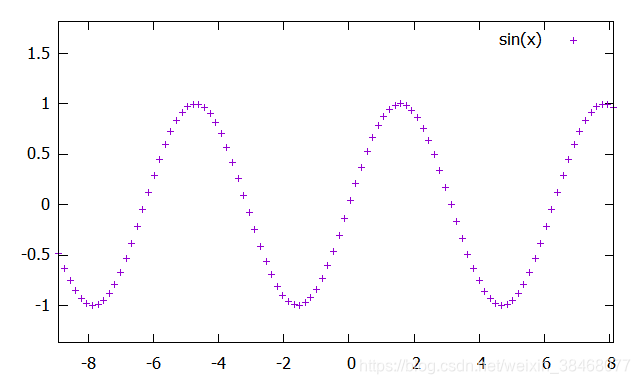
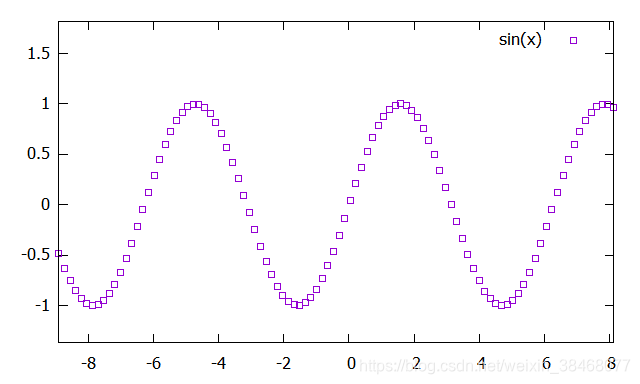
plot sin(x) w p
//表示使用点画
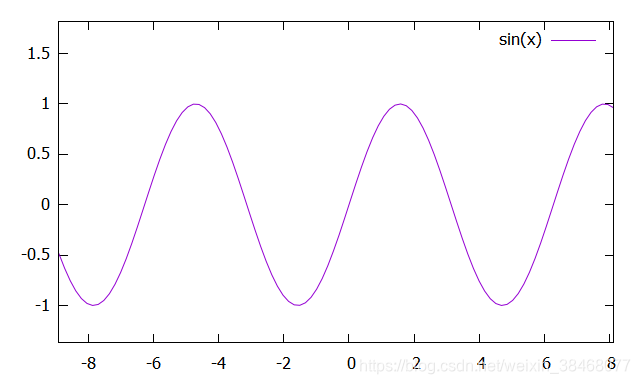
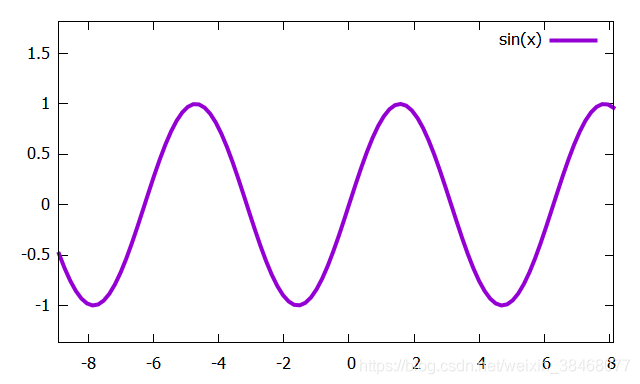
plot sin(x) w l
//表示使用线画

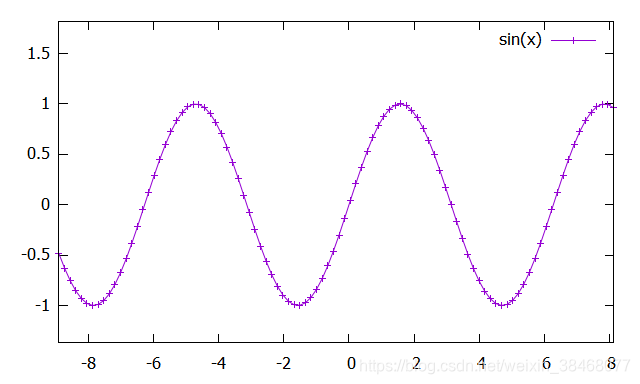
plot sin(x) w lp
//表示使用点和线画
plot sin(x) w lp lt 0
//表示使用点和线画,线的种类为0

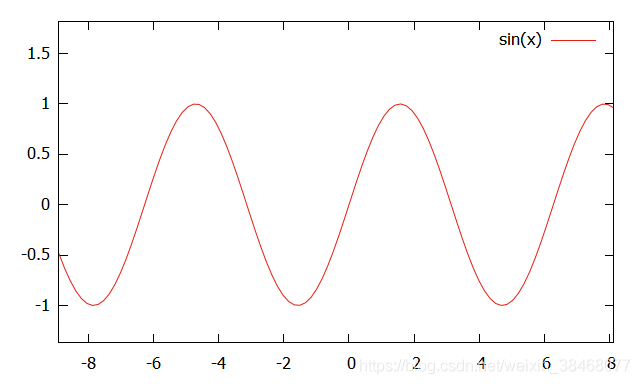
plot sin(x) w l lt 1
//表示使用线画,线的种类为1
plot sin(x) w l lt 7
//表示使用线画,线的种类为7
plot sin(x) w l lt 1 lw 4
//表示使用线画,线的种类为1,线的宽度为4
plot sin(x) w p pt 4
//表示使用点画,点的种类为4
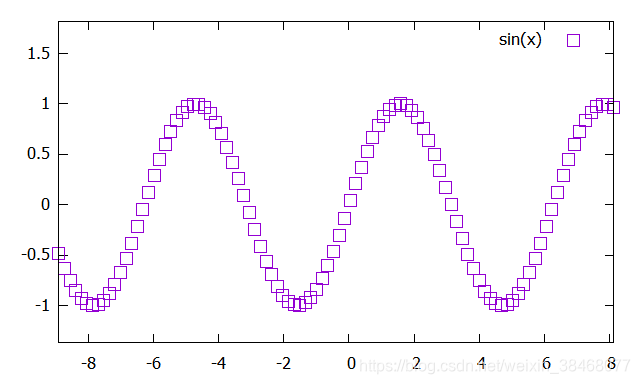
plot sin(x) w p pt 4 ps 2
//表示使用点画。点的种类为4,点的大小为2
1.3 其它参数介绍(约定范围、坐标轴设定)
1.3.1 约束画图范围
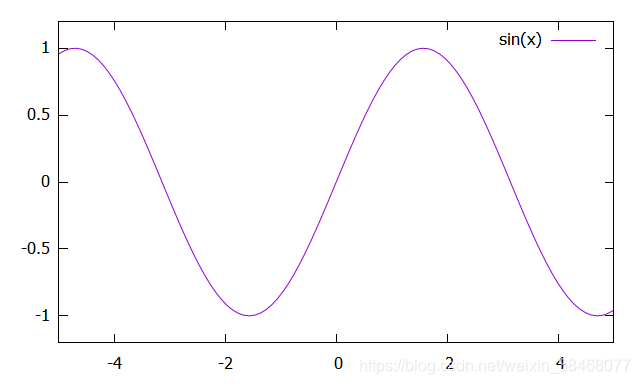
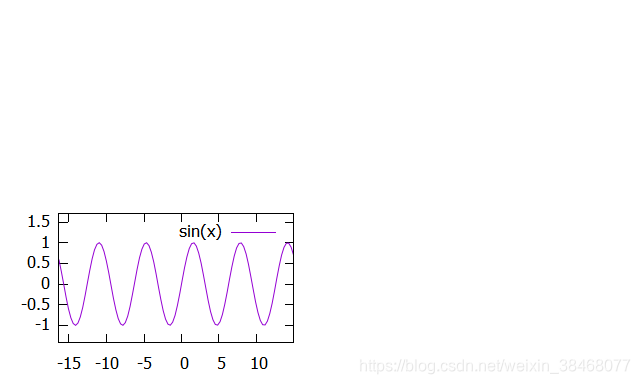
plot [-5:5] [-1.2:1.2] sin(x)
//表示x取值范围为[-5,5],y的取值范围为[-1.2,1.2]
1.3.2 关于坐标轴的设定
在对于坐标轴的设定,要注意的一点就是,在画图之前执行命令。
命令含义set xlabel ‘x’x轴标为‘x’set ylabel ‘y’y轴标为’y’set ylabel ‘DOS’ tc lt 3‘DOS’的颜色用第三种颜色set xtics 1.0x轴的主刻度的宽度为1.0,同样可以为y轴定义yticsset mxtics 3x轴上每个主刻度中画3个分刻度,同样可以为y轴定义myticsset border 3设为第三种边界,同样可以为上边的x轴(称为x2)和右边y(称为y2)轴进行设置,即x2tics,mx2tics,y2tics,my2tics。set xtics nomirror去掉上边x的刻度,同样可以为ytics设置unset x2tics去掉上边x的标度,同样可以为y2tics设置
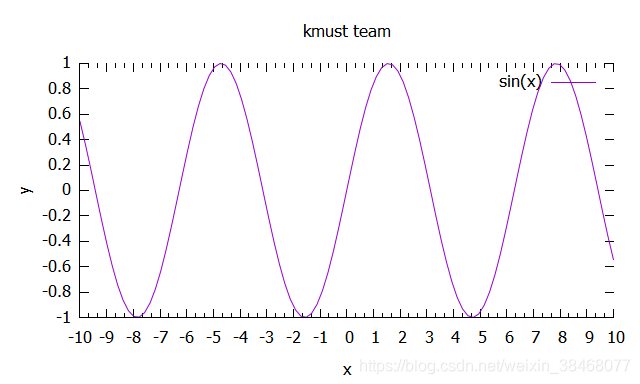
下面我们就来验证一下上边的图吧。
gnuplot> set title 'kmust team'
gnuplot> set xlabel 'x'
gnuplot> set ylabel 'y'
gnuplot> set xtics 1.0
gnuplot> set mxtics 3
gnuplot> set border 3
gnuplot> plot sin(x)
gnuplot>
1.3.3 图例
命令含义set key left放在左边,有left 和right两个选项set key bottom放在下边,只有这一个选项;默认在上边set key outside放在外边,但只能在右面的外边set key left bottom表示放在左下边
代码示例:
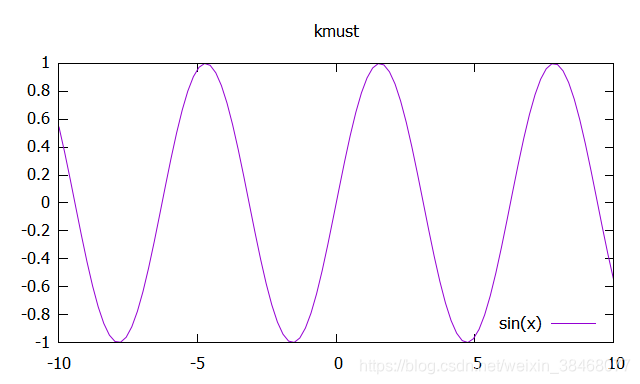
set key right bottom
gnuplot> set title "kmust"
gnuplot> plot sin(x)
//将图例放在右下角
//设置标题为“kmust”
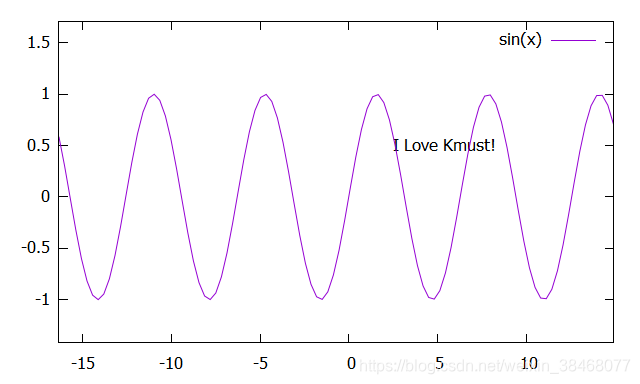
1.3.4 在图中任意位置插入文字
gnuplot> set label 'I Love Kmust!' at 2.5,0.5
gnuplot> plot sin(x)
//在坐标(2.5,0.5)处插入文字
//如果想要删除文字就使用 unset label 1(此处数字代表要删除label的序号)
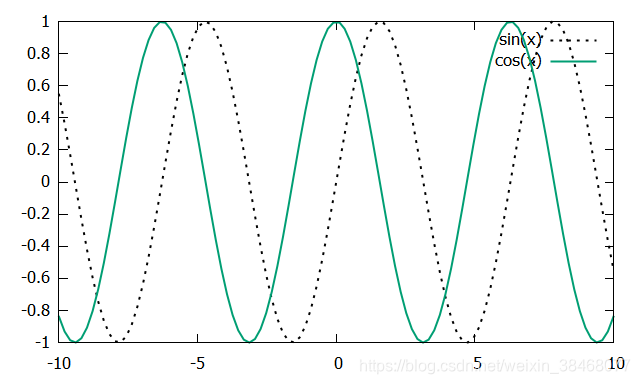
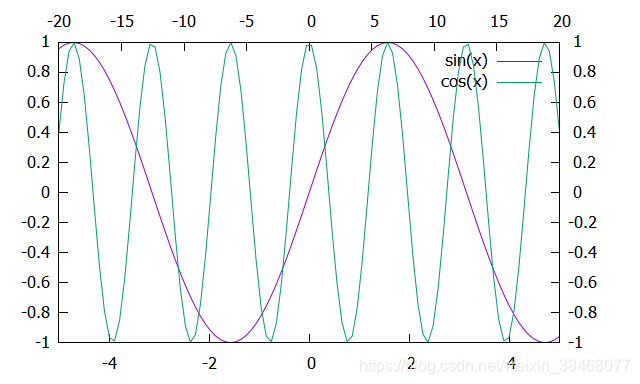
1.4 同时画出多条曲线
plot sin(x),cos(x)
//注意连个函数之间要使用逗号分隔开
 当然两个函数之间也可以单独约束 当然两个函数之间也可以单独约束
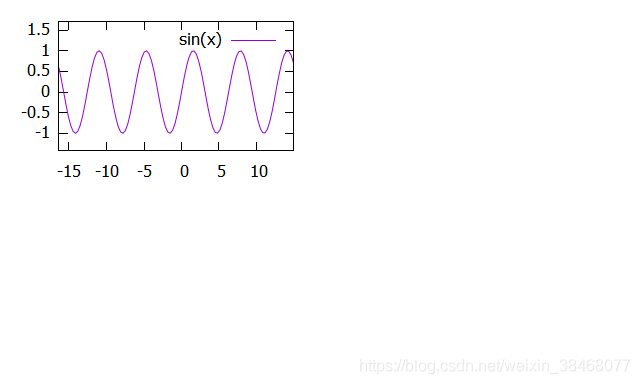
plot sin(x) title 'sin(x)' w l lt 0 lw 2, cos(x) title 'cos(x)' w l lt 2 lw 2
//注意连个函数之间要使用逗号分隔开,每个函数的绘画要求紧跟着对应的函数
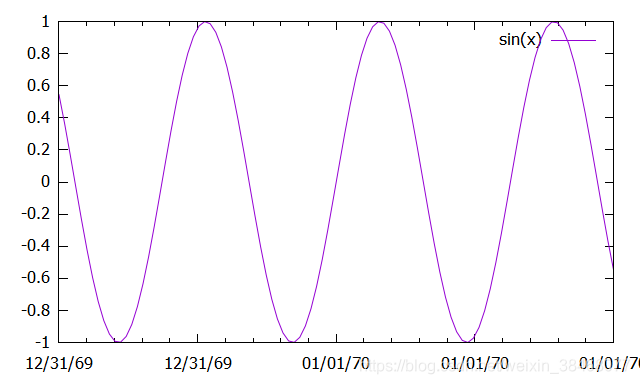
1.5 x轴时间设置
命令含义set xdata timeX轴设置为时间格式set timefmt “%Y-%m-%d”文件中时间格式set format x “%m/%d”目标时间格式~
gnuplot> set xdata time
gnuplot> set timefmt "%Y-%m-%d"
gnuplot> plot sin(x)
//设置x轴为时间格式,并且其显示形式为年-月-日
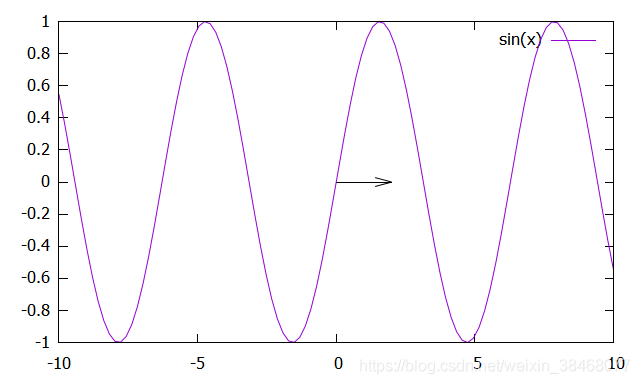
1.6 在图中添加直线和箭头
gnuplot> set arrow from 0.0,0.0 to 2.0,0.0
gnuplot> plot sin(x)
//在图的中心点(0,0)向(2,0)画一条射线
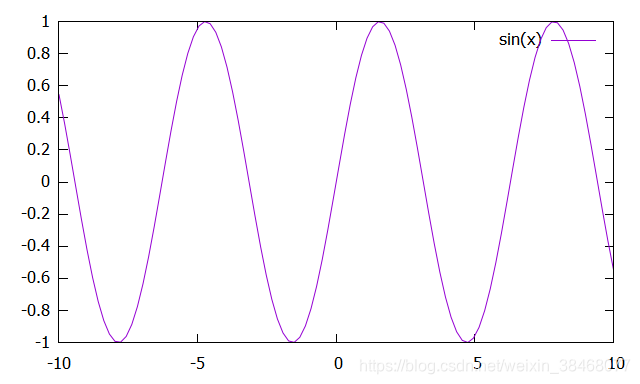
gnuplot> set arrow from 0.0,0.0 to 0.0,-0.4 nohead
gnuplot> plot sin(x)
//只画一条直线的话,在画箭头的语句上方添加nohead标签
//从中心点(0,0)到(0,-0.4)画一条直线
 除此之外我们还可以进行颜色调制 除此之外我们还可以进行颜色调制
gnuplot> set arrow from 0.0,0.0 to -2.0,0.4 lt 2 lw 2
gnuplot> plot sin(x)
//从中心点(0,0)到(-2.0,0.4)画一条绿色射线,线条粗细等级为2
 如果我们不小心画错了一个图形,我们又该如何删除呢,很简单,一句话就搞定了。 如果我们不小心画错了一个图形,我们又该如何删除呢,很简单,一句话就搞定了。
gnuplot> unset arrow 3
gnuplot> unset arrow 2
gnuplot> unset arrow 1
gnuplot> plot sin(x)
//如果我们发现第几个值线画错了,就可以使用语句unset删除对应的直线即可
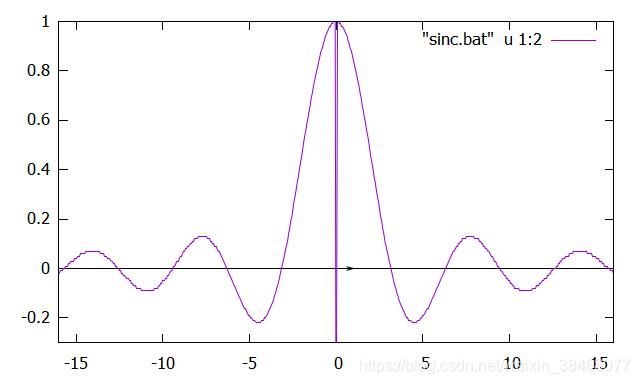
1.7 读取dat、txt文件进行画图
在用c语言进行程序设计的时候,有时就需要画图任务,这时gnuplot可以读取dat、txt文件内的内容,并再进行绘画。
gnuplot> set arrow from -16.0,0.0 to 16.0,0.0 nohead
gnuplot> set arrow from -0.3,0.0 to 1.0,0.0
gnuplot> plot [-16:16] [-0.3:1] "sinc.bat" u 1:2 w l lt 1 lw 1
//从(-16,0)到(16,0)画一条直线
//从(-0.3,0)到(1.0,0)画一条带箭头射线
//读取“sinc.bat”文件内的数据,并用其内的第一列和第二列作图,,并且设置线条颜色和粗细。
1.8 设定图的大小和位置
gnuplot> set size 0.5,0.5
gnuplot> plot sin(x)
//长宽均为默认宽度的一半,建议用这个取值,尤其是画成ps或eps图形的时候
gnuplot> set origin 0.0,0.5
gnuplot> plot sin(x)
//设定图的最左下角的那一点在图形面板中的位置。这里图将出现在左上角。
1.9 画多个图
gnuplot> set multiplot
//设置为多图模式
multiplot> set origin 0.0,0.5
//设置第一个图的原点的位置
multiplot> set size 0.5,0.5
//设置第一个图的大小,长和宽均为整个图的一半
multiplot> plot tan(x)
//开始绘制第一个图
multiplot> set origin 0.5,0.5
//设置第2个图的原点的位置
multiplot> set size 0.5,0.5
//设置第2个图的大小,长和宽均为整个图的一半
multiplot> plot cos(x)
//开始绘制第2个图
multiplot> set origin 0.0,0.0
//设置第3个图的原点的位置
multiplot> set size 0.5,0.5
//设置第3个图的大小,长和宽均为整个图的一半
multiplot> plot sin(x)
//开始绘制第3个图
multiplot> set origin 0.5,0.0
//设置第4个图的原点的位置
multiplot> set size 0.5,0.5
//设置第4个图的大小,长和宽均为整个图的一半
multiplot> plot 1/x
//开始绘制第4个图
绘制完成之后就会出现这个四合一的图,当然我们还可以 为每个图设置自己的特有属性,比如颜色、标题等。 
2.gnuplot进阶
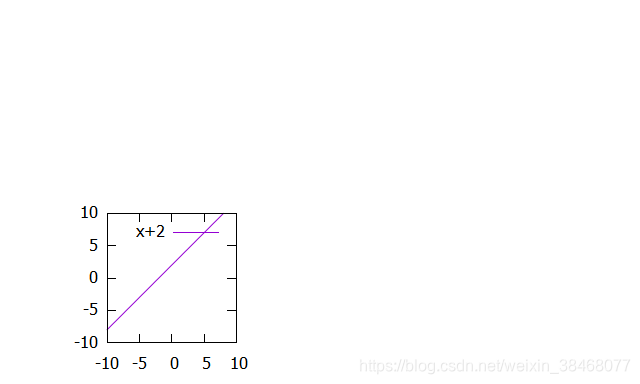
2.1 使两坐标轴的单位长度等长
gnuplot> set size square
//设置形状为方形
gnuplot> set size 0.5,0.5
//设置图形的大小各为一半
gnuplot> set xrange[-10:10]
gnuplot> set yrange[-10:10]
//设置x,y的范围相同
gnuplot> plot x+2
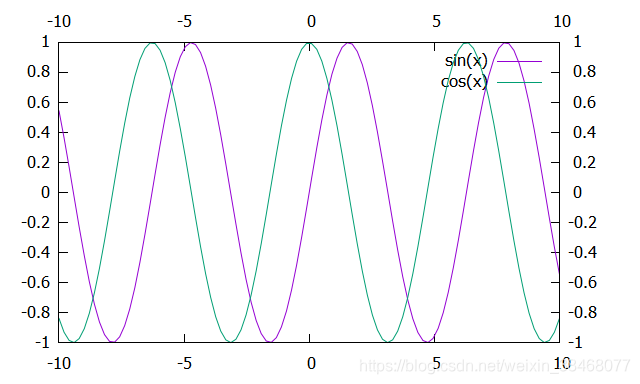
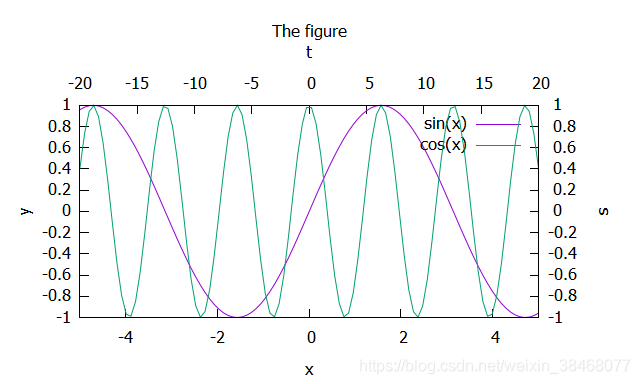
2.2 在同一张图里利用左右两边的y轴分别画图
gnuplot> set xtics nomirror
//去掉上边坐标轴x2的刻度
gnuplot> set ytics nomirror
//去掉上边坐标轴y2的刻度
gnuplot> set x2tics
//让上面坐标轴x2刻度自动产生
gnuplot> set y2tics
//让上面坐标轴y2刻度自动产生
gnuplot> plot sin(x),cos(x) axes x1y2
//用x1y2坐标,axes x1y2表示用x1y2坐标轴
gnuplot> plot sin(x),cos(x) axes x2y2
//用x2y2坐标,axes x2y2表示用x2y2坐标轴
gnuplot> set x2range[-20:20]
//设定x2坐标的范围
gnuplot> report

gnuplot> set xrange[-5:5]
//设定x的范围
gnuplot> replot
gnuplot> set xlabel 'x'
gnuplot> set x2label 't'
gnuplot> set ylabel 'y'
gnuplot> set y2label 's'
//为图形的上下左右分别起标
gnuplot> replot

gnuplot> set title 'The figure'
//设置标题
gnuplot> replot
2.3画漂亮的pm3D图
gnuplot> set pm3d
//设置pm3d模式
gnuplot> set isosamples 50,50
//设置网格点为50x50
gnuplot> splot x**2+y**2
//画三维图像

2.4 画等高线
gnuplot> set dgrid3d 100,100
//设置三维表面的网格书目
gnuplot> set contour
//设置画等高线
gnuplot> splot x**2+y**2
//画图像

2.5 利用脚本文件避免重复输入
我在文件夹下创建了一个 try.plt文件,其内容如下所示
reset
//重置画图属性
set pm3d
//设置为pm3d模式
unset ztics
//取消z轴标题
set isosamples 200,200
//设置网格属性为200x200
splot x**2+y**2 w pm3d
//开始画图并且设置为pm3d模式
然后只需在gnuplot命令界面输入
load 'try.plt'
//加载plt文件,执行画图任务
其结果如下所示: 
2.6 gnuplot画GIF动图
set term gif animate
//设置可以画动画
set output "e1.gif"
//设置输出的文件路径
set xrange [0:4*pi]
set yrange [-1:1]
//设置x,y范围
do for [i=0:40]{
plot sin(x+i*pi/40) lw 1.5 title sprintf("t=%i",i)
}
//循环输出图像
set output
3.参考文章
gnuplot使用: https://www.cnblogs.com/waterystone/p/5085801.html gnuplot生成gif动图:https://blog.csdn.net/weixin_34187862/article/details/85648365 gnuplot三维绘图;https://blog.csdn.net/ouening/article/details/72141345
|