| 非侵入式监控PHP应用性能监控分析 | 您所在的位置:网站首页 › Php性能测试监控 › 非侵入式监控PHP应用性能监控分析 |
非侵入式监控PHP应用性能监控分析
|
前言
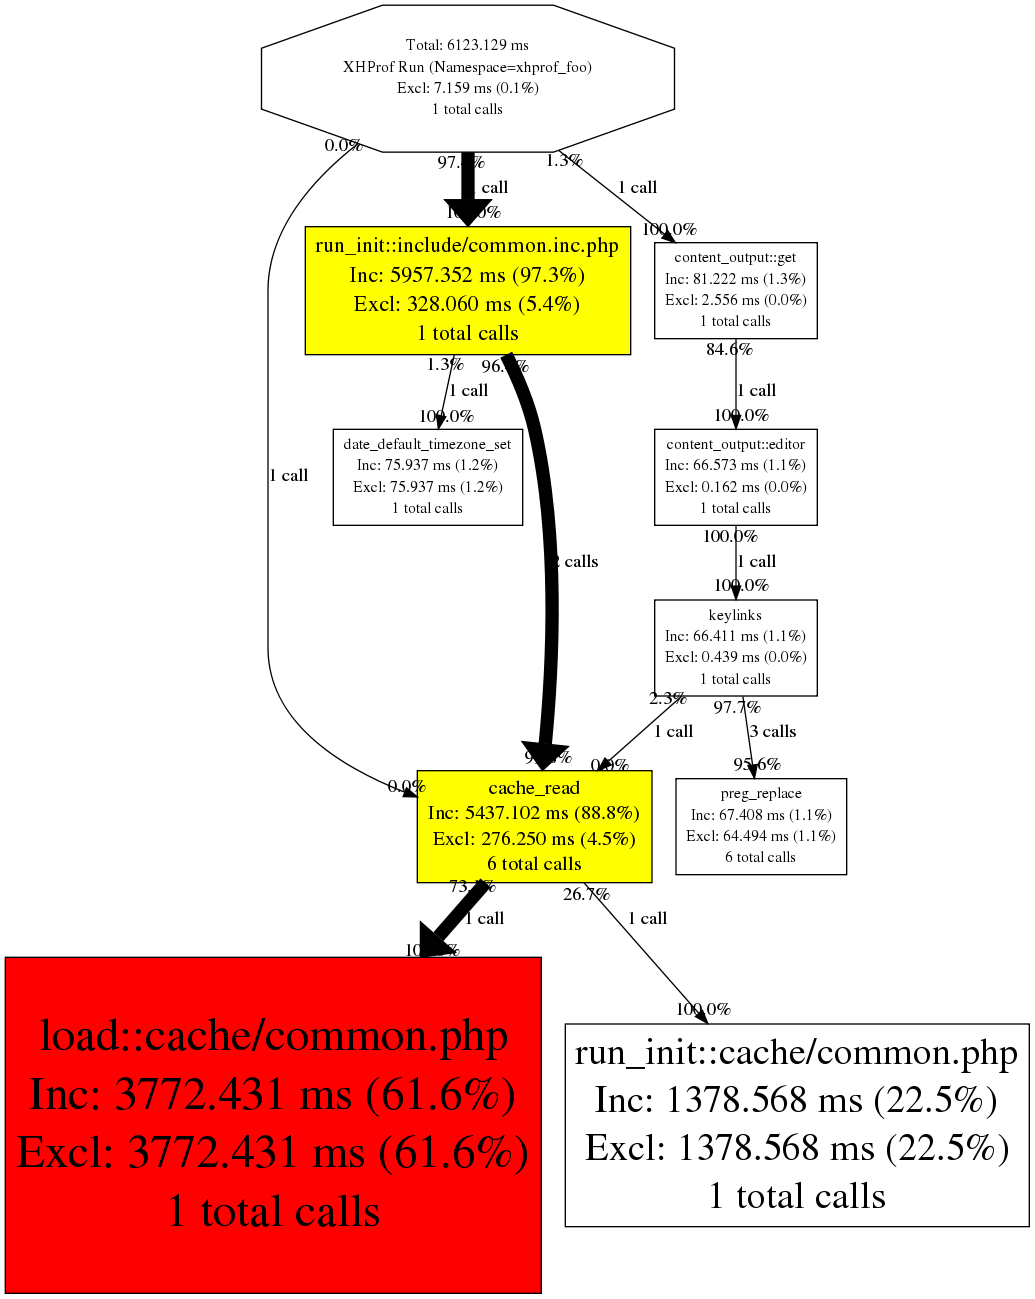
所谓非侵入式监控PHP应用性能,就是不修改现有系统代码,而对系统进行监控。这样的系统才能更容易的应用到PHP应用中。这里抛砖引玉,欢迎大家交流。 方案一如果只是监控每次请求的访问时间。直接检测nginx的日志即可。在nginx的日志中有两个选项。$request_time 和 $upstream_response_time 。 这两个选项记录了响应时间。 1、$request_time 指的就是从接受用户请求的第一个字节到发送完响应数据的时间,即包括接收请求数据时间、程序响应时间、输出响应数据时间。 2、$upstream_response_time 是指从Nginx向后端(php-cgi)建立连接开始到接受完数据然后关闭连接为止的时间。 如果只是监控后端PHP服务的性能,只要更多的关注 $upstream_response_time 这个选项即可。 方案二如果还想进一步一个PHP请求处理过程中,具体那部分占用时间比较多,就需要借助xhprof了。xhprof可以生成调用关系图,一目了然的可以看出那部分占用时间比较多。如下图(来源于网络): 下面是完整的搭建步骤: 下载安装xhprof1、下载编译安装的命令如下: $wget https://github.com/phacility/xhprof/archive/master.zip $unzip ./xhprof_master.zip $cd ./xhprof_master/extension $/usr/local/php/bin/phpize $./configure --with-php-config=/usr/local/php/bin/php-config $make $make install注意,我的php是安装在/usr/local/php目录。根据您的情况,适当修改上面的路径。 2、修改配置文件php.ini $vim /etc/php.ini底部增加如下内容: [xhprof] extension=xhprof.so xhprof.output_dir=/tmp/xhprof 3、通过下面的命令检测xhprof是否安装成功 $/usr/local/php/bin/php -m如果以上命令输出内容中有xhprof字样,说明xhprof扩展安装成功。 4、拷贝xhprof相关程序到指定目录 $mkdir -p /www/sites/xhprof $cp -r ./xhprof_master/xhprof_html /www/sites/xhprof $cp -r ./xhprof_master/xhprof_lib /www/sites/xhprof 5、修改nginx配置,以便通过url访问性能数据: 在nginx中增加如下代码: server { listen 8999; root /opt/sites/xhprof/; index index.php index.html; location ~ .*\.php$ { add_header Cache-Control "no-cache, no-store, max-age=0, must-revalidate"; add_header Pragma no-cache; add_header Access-Control-Allow-Origin *; add_header Via "1.0 xgs-150"; fastcgi_pass 127.0.0.1:9000; fastcgi_index index.php; include fastcgi.conf; fastcgi_connect_timeout 300; fastcgi_send_timeout 300; fastcgi_read_timeout 300; } } 6、部署性能数据采集程序 把xhprof.php文件部署到 /www/sites/xhprof.php 。xhprof.php文件内容如下:把这个代码文件部署到/www/sites/xhprof.php目录后,就可以启用这个文件了。因为我们想对PHP应用代码不进行代码侵入,那么我们就只能通过如下几种方式启用: * Nginx/PHP-FPM 方式: fastcgi_param PHP_VALUE "auto_prepend_file=/www/sites/xhprof.php"; * Apache 方式: php_value auto_prepend_file "/www/sites/xhprof.php" * php.ini 方式: auto_prepend_file="/www/sites/xhprof.php" 注意:如果使用了 opcode 缓存,记得要重启你的 php 进程。 7、查看性能分析日志 $tail /tmp/xhprof.log $cost_time||200||run_id||adadfdsadad||request_uri||/i/content/getcontent.json 上面输出内容中: cost_time 耗时 200毫秒 run_id 为 adadfdsadad request_uri 为 /i/content/getcontent.json 8、根据run_id 查看性能分析数据 http://127.0.0.1:8999/xhprof_html/index.php?run=adadfdsadad 查看方式请参考 http://www.cnblogs.com/siqi/p/3790186.html 注意: 1、在正式启用前,一定要确认不会影响正常的数据输出。确认输出内容无异后,再上线。 2、每个url的max_time不要设置的过小。 3、xhprof会影响线上服务的性能,因此最好只在一台机器上进行监控,或者 修改xhprof.php代码,对请求进行随机监控。 |
【本文地址】