QT绘制实时动态曲线 |
您所在的位置:网站首页 › 数据绘制曲线图 › QT绘制实时动态曲线 |
QT绘制实时动态曲线
|
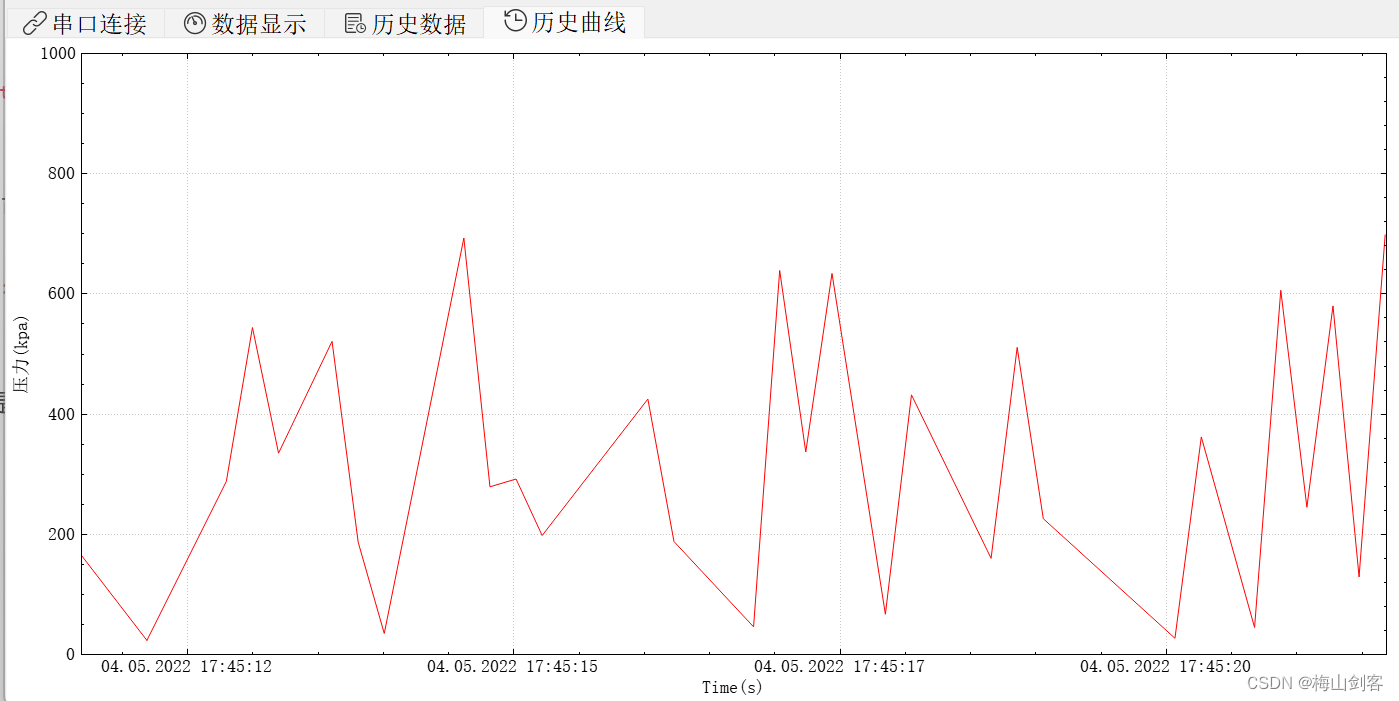
在QT绘制实时动态曲线——qcustomplot使用(一)中,介绍使用官方的demo实现动态实时曲线。 官方代码移植针对动态显示数据项目要求,移植官方代码demo 开启绘图的函数 void Widget::setupRealtimeDataDemo(QCustomPlot *customPlot) { customPlot->addGraph(); // red line customPlot->graph(0)->setPen(QPen(Qt::red)); customPlot->graph(0)->setAntialiasedFill(true); customPlot->graph(0)->setName("VL压力"); customPlot->addGraph(); // darkYellow line customPlot->graph(1)->setPen(QPen(Qt::darkYellow)); customPlot->graph(1)->setAntialiasedFill(true); customPlot->graph(1)->setName("AC1压力"); customPlot->addGraph(); // black line customPlot->graph(2)->setPen(QPen(Qt::black)); customPlot->graph(2)->setAntialiasedFill(true); customPlot->graph(2)->setName("AC2压力"); customPlot->addGraph(); // green line customPlot->graph(3)->setPen(QPen(Qt::green)); customPlot->graph(3)->setAntialiasedFill(true); customPlot->graph(3)->setName("AS压力"); customPlot->addGraph(); // blue line customPlot->graph(4)->setName("SR压力"); customPlot->graph(4)->setPen(QPen(Qt::blue)); customPlot->graph(4)->setAntialiasedFill(true); customPlot->addGraph(); // magenta line customPlot->graph(5)->setPen(QPen(Qt::magenta)); customPlot->graph(5)->setAntialiasedFill(true); customPlot->graph(5)->setName("BC压力"); customPlot->xAxis->setLabel("Time(s)"); customPlot->yAxis->setLabel("压力(kpa)"); QSharedPointer timeTicker(new QCPAxisTickerDateTime); //时间日期作为X轴 timeTicker->setDateTimeFormat("dd.MM.yyyy hh:mm:ss"); customPlot->xAxis->setTicker(timeTicker); customPlot->xAxis->setRange(0, 1000); customPlot->axisRect()->setupFullAxesBox(); customPlot->yAxis->setRange(0, 1000); customPlot->setInteractions(QCP::iRangeDrag|QCP::iRangeZoom|QCP::iSelectPlottables);//可以缩放可以滚动点击选择 // make left and bottom axes transfer their ranges to right and top axes: connect(customPlot->xAxis, SIGNAL(rangeChanged(QCPRange)), customPlot->xAxis2, SLOT(setRange(QCPRange))); connect(customPlot->yAxis, SIGNAL(rangeChanged(QCPRange)), customPlot->yAxis2, SLOT(setRange(QCPRange))); // setup a timer that repeatedly calls MainWindow::realtimeDataSlot: connect(&dataTimer, SIGNAL(timeout()), this, SLOT(realtimeDataSlot())); dataTimer.start(10); // Interval 0 means to refresh as fast as possible } 绘制图的槽函数 void Widget::realtimeDataSlot() { // calculate two new data points: double key = QDateTime::currentDateTime().toMSecsSinceEpoch()/1000.0;// time elapsed since start of demo, in seconds static double lastPointKey = 0; if (key-lastPointKey > 0.2) // at most add point every 2 ms { // add data to lines: customPlot->graph(0)->addData(key, rand()%700); customPlot->graph(1)->addData(key, rand()%700); customPlot->graph(2)->addData(key, rand()%500); customPlot->graph(3)->addData(key, rand()%400); customPlot->graph(4)->addData(key, rand()%250); customPlot->graph(5)->addData(key, rand()%100); lastPointKey = key; } customPlot->xAxis->setRange(key, 10, Qt::AlignRight); //设置x轴的范围 显示个数为8个 customPlot->replot(); // calculate frames per second: static double lastFpsKey; static int frameCount; ++frameCount; if (key-lastFpsKey > 2) // average fps over 2 seconds { lastFpsKey = key; frameCount = 0; } }然后,在widget.h中添加一些变量的声明,在widget.c文件中new需要的新对象。 改动的内容如下:1、绘图以当前时间日期为X轴,在官方的代码demo中进行修改。 QSharedPointer timeTicker(new QCPAxisTickerDateTime); //时间日期作为X轴 timeTicker->setDateTimeFormat("dd.MM.yyyy hh:mm:ss"); customPlot->xAxis->setTicker(timeTicker);定义X轴的显示内容为当前时间!!! double key = QDateTime::currentDateTime().toMSecsSinceEpoch()/1000.0;2、 配置界面可以为缩放、可以滚动、可以选择 customPlot->setInteractions(QCP::iRangeDrag|QCP::iRangeZoom|QCP::iSelectPlottables);//可以缩放可以滚动点击选择3、定时器开启间隔,之前的demo是0,没有修改之前刷新太快。 dataTimer.start(10);效果如下:
|
 4、添加多条曲线
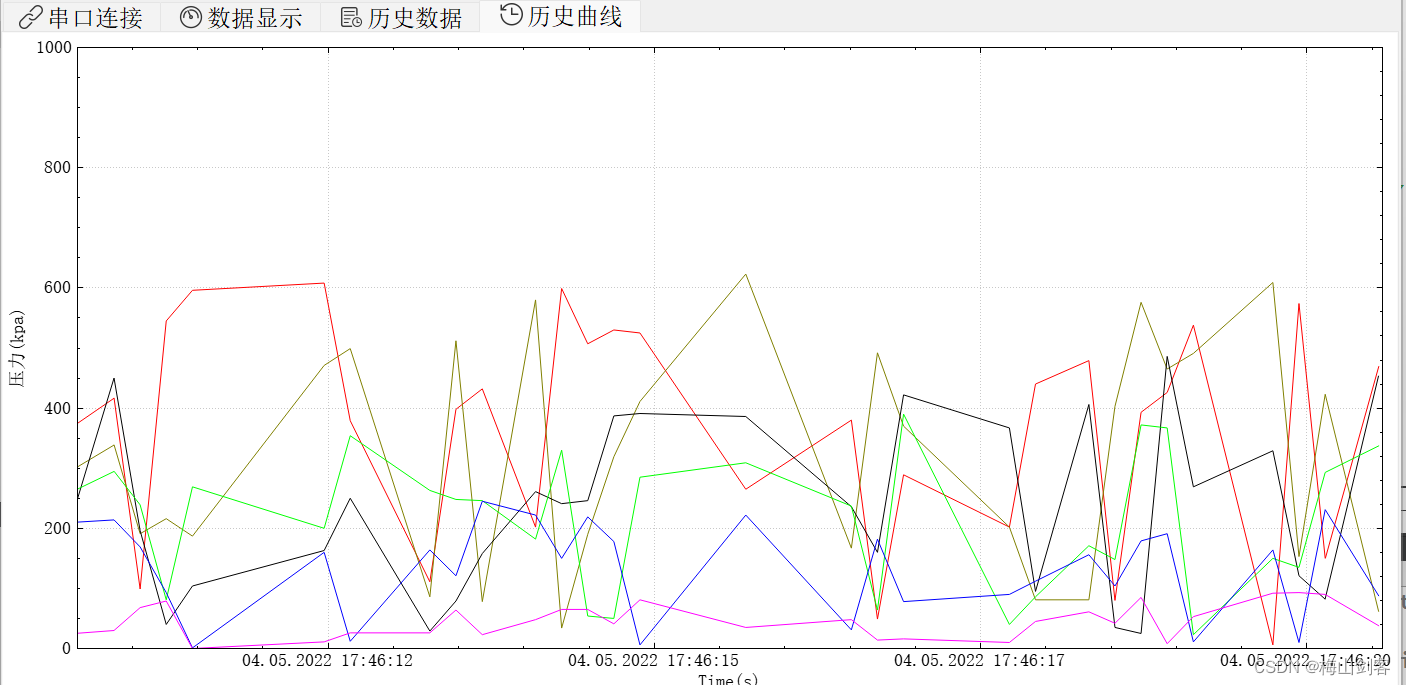 总结:之前使用Qchart绘图,线条数据变多,就发现界面发非常卡顿,现在使用qcustomplot绘图解决了这个问题,而且添加曲线也非常好用。
【本文地址】
公司简介
联系我们
今日新闻 |
点击排行 |
|
推荐新闻 |
图片新闻 |
|
专题文章 |