|
python 绘制世界地图,添加海岸线、陆地、投影等
tips:最近在学习python的模块:matplotlib
为画全球的要素分布做准备
在此之前,先学习一下如何绘制世界地图,以及一些投影的使用。
首先引用如下三个库
import cartopy.crs as ccrs
import matplotlib.pyplot as plt
import cartopy.feature as cfeature
其中,Cartopy是一个Python库,用于地理空间数据处理,以便生成地图和其他地理空间数据分析。 matplotlib.pyplot是matplotlib基于状态的接口。 它提供了类似于MATLAB的绘图方式。 pyplot主要用于交互式绘图和程序化绘图生成的简单情况:
import numpy as np
import matplotlib.pyplot as plt
x = np.arange(0, 5, 0.1)
y = np.sin(x)
plt.plot(x, y)
成图如下: 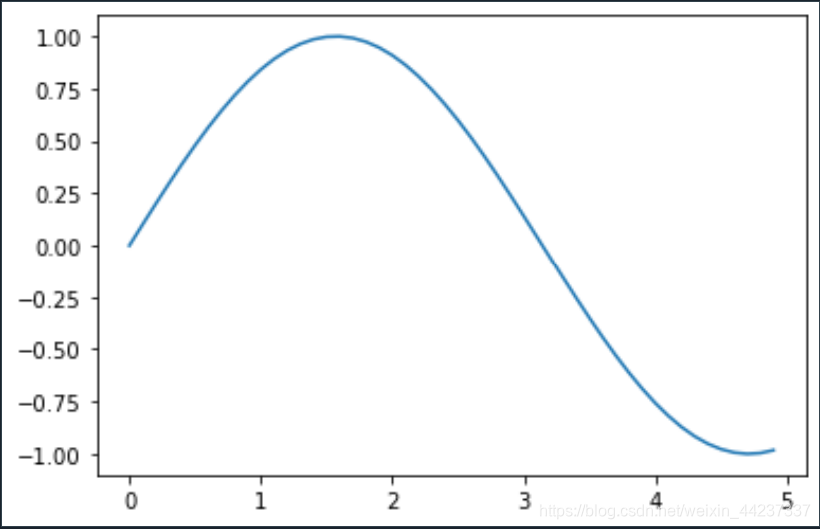 为了使地图更加多样化,可以引入cartopy.feature ,内置了许多有用的功能。这些“默认功能”的分辨率为110m。 为了使地图更加多样化,可以引入cartopy.feature ,内置了许多有用的功能。这些“默认功能”的分辨率为110m。
cartopy.feature.BORDERS Country boundaries#添加城市边界
cartopy.feature.COASTLINE Coastline, including major islands cartopy.feature.LAKES Natural and artificial lakes
cartopy.feature.LAND Land polygons, including major islands
cartopy.feature.OCEAN Ocean polygons
cartopy.feature.RIVERS Single-line drainages, including lake centerlines
cartopy.feature.STATES (limited to the United States at this scale)
下面开始绘图,在绘图之前,要先准备一个画板,然后设置你需要的投影方式。
import matplotlib.pyplot as plt
import cartopy.crs as ccrs
import cartopy.feature as cfeature
fig=plt.figure(figsize=(20,15))#设置一个画板,将其返还给fig
ax = fig.add_subplot(1, 1, 1, projection=ccrs.PlateCarree())
plt.show()
# 在一个画板中添加子图,并设置投影方式。1,1,1分别代表行、列、在网格中子图位置。并将其返回给ax
 下面添加海岸线: 下面添加海岸线:
import matplotlib.pyplot as plt
import cartopy.crs as ccrs
import cartopy.feature as cfeature
fig=plt.figure(figsize=(20,15))#设置一个画板,将其返还给fig
ax = fig.add_subplot(1, 1, 1, projection=ccrs.PlateCarree())
ax.coastlines()
plt.show()
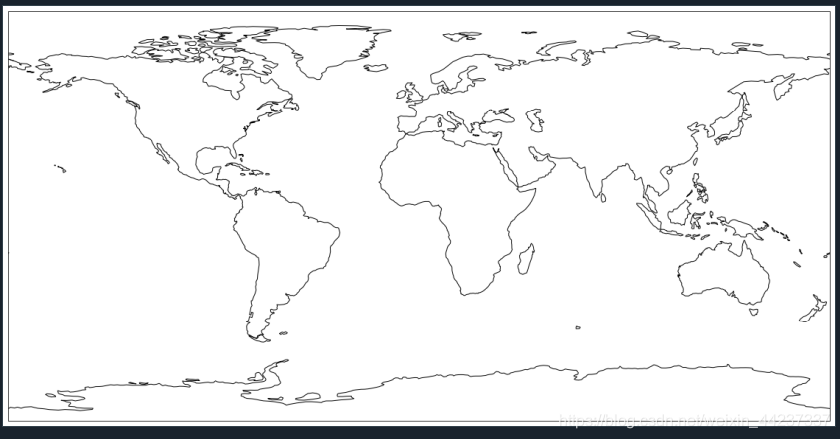 当当当,这样就有点雏形啦,下面可以再加上一点自己感兴趣的东西,比如给他加上地球背景。加上如下一句代码试试发生了什么? 当当当,这样就有点雏形啦,下面可以再加上一点自己感兴趣的东西,比如给他加上地球背景。加上如下一句代码试试发生了什么?
ax.stock_img()#添加地球背景
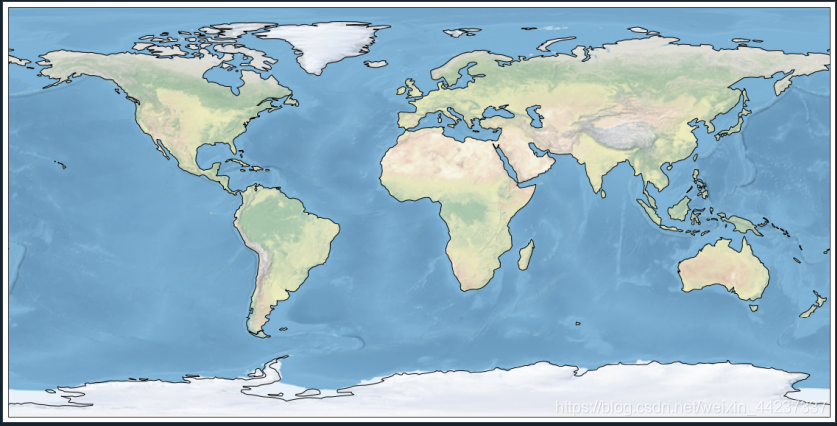 嗯~真不错! 还记得开始前介绍的cartopy.feature吗?使图片更加多元就靠他啦,加上你想要的元素,我这里加入了海洋,陆地,湖泊,河流,网格线,让我们看看效果: 嗯~真不错! 还记得开始前介绍的cartopy.feature吗?使图片更加多元就靠他啦,加上你想要的元素,我这里加入了海洋,陆地,湖泊,河流,网格线,让我们看看效果:
ax.add_feature(cfeature.OCEAN)
ax.add_feature(cfeature.LAND, edgecolor='black')
ax.add_feature(cfeature.LAKES, edgecolor='black')#边缘为黑色
ax.add_feature(cfeature.RIVERS)
rivers_110m = cfeature.NaturalEarthFeature('physical', 'rivers_lake_centerlines', '110m')
ax.add_feature(rivers_110m, facecolor='None', edgecolor='b')
ax.gridlines(draw_labels=True, xlocs=[-179, -90, 0, 90,179])#添加网格线,true
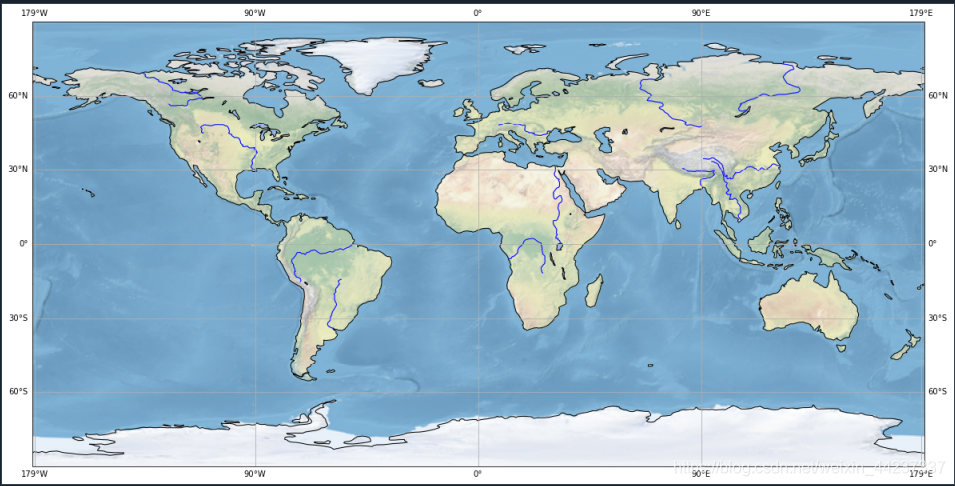 乍一看感觉不是很明显,这是因为我们再次之前已经加上地球背景了,我们可以将那句代码去掉再看看效果。 乍一看感觉不是很明显,这是因为我们再次之前已经加上地球背景了,我们可以将那句代码去掉再看看效果。
import matplotlib.pyplot as plt
import cartopy.crs as ccrs
import cartopy.feature as cfeature
fig=plt.figure(figsize=(20,15))#设置一个画板,将其返还给fig
ax = fig.add_subplot(1, 1, 1, projection=ccrs.PlateCarree())
ax.coastlines()
ax.add_feature(cfeature.OCEAN)
ax.add_feature(cfeature.LAND, edgecolor='black')
ax.add_feature(cfeature.LAKES, edgecolor='black')#边缘为黑色
ax.add_feature(cfeature.RIVERS)
rivers_110m = cfeature.NaturalEarthFeature('physical', 'rivers_lake_centerlines', '110m')
ax.add_feature(rivers_110m, facecolor='None', edgecolor='b')
ax.gridlines(draw_labels=True, xlocs=[-179, -90, 0, 90,179])#添加网格线,true
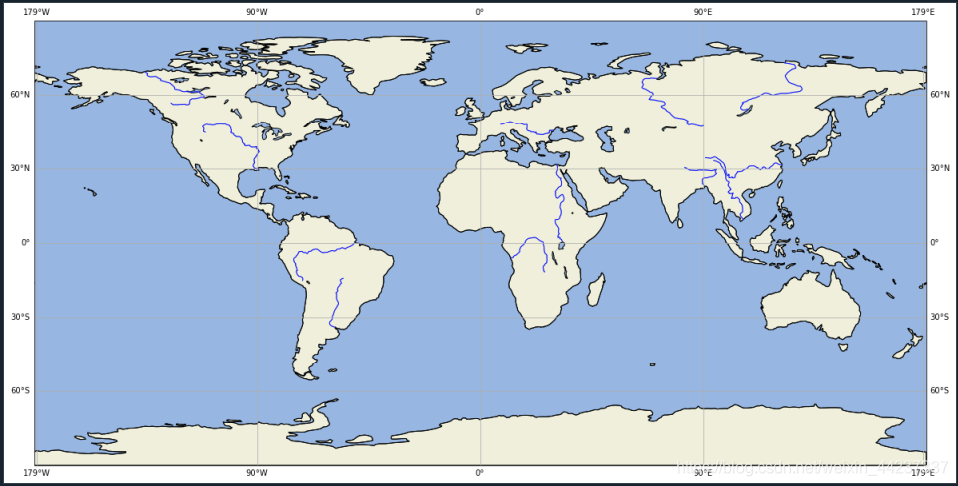 这样子就比较明了啦! 分享一些其他的小技巧以及投影: 这样子就比较明了啦! 分享一些其他的小技巧以及投影:
set_global - zoom the map out as much as possible#尽可能缩小地图
set_extent - zoom the map to the given bounding box#将地图缩放到给定的边界框
gridlines - add a graticule (and optionally labels) to the axes#在轴上添加刻度线(和可选的标签)
coastlines - add Natural Earth coastlines to the axes#给轴上添加自然的地球海岸线
stock_img - add a low-resolution Natural Earth background image to the axes#将低分辨率自然地球背景图像添加到轴
imshow - add an image (numpy array) to the axes#向轴添加图像(numpy数组)
add_geometries - add a collection of geometries (Shapely) to the axes#向轴添加几何形状(形状)集合
projections = [ccrs.PlateCarree(),
ccrs.Robinson(),
ccrs.Mercator(),
ccrs.Orthographic(),
ccrs.InterruptedGoodeHomolosine()
]
#具体作用可以自己尝试!!!
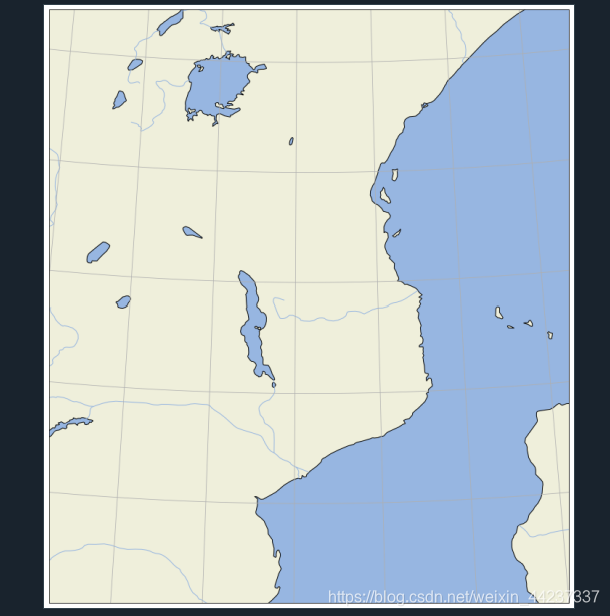
最后的最后,把绘制部分区域的代码也贴上啦
import matplotlib.pyplot as plt
import cartopy.feature as cfeature
import numpy as np
import cartopy.crs as ccrs
central_lat = 37.5
central_lon = -96
extent = [28, 45, -25, 2]
central_lon = np.mean(extent[:2])
central_lat = np.mean(extent[2:])
fig=plt.figure(figsize=(20, 15))
ax = fig.add_subplot(1, 1, 1, projection=ccrs.EquidistantConic(central_lon, central_lat))
ax.set_extent(extent)
ax.add_feature(cfeature.OCEAN)
ax.add_feature(cfeature.LAND, edgecolor='black')
ax.add_feature(cfeature.LAKES, edgecolor='black')
ax.add_feature(cfeature.RIVERS)
ax.gridlines()
一个努力学习python的海洋小白
水平有限,欢迎指正!!!
欢迎评论、收藏。
|