Prometheus性能调优 |
您所在的位置:网站首页 › pod是指什么 › Prometheus性能调优 |
Prometheus性能调优
| 背景
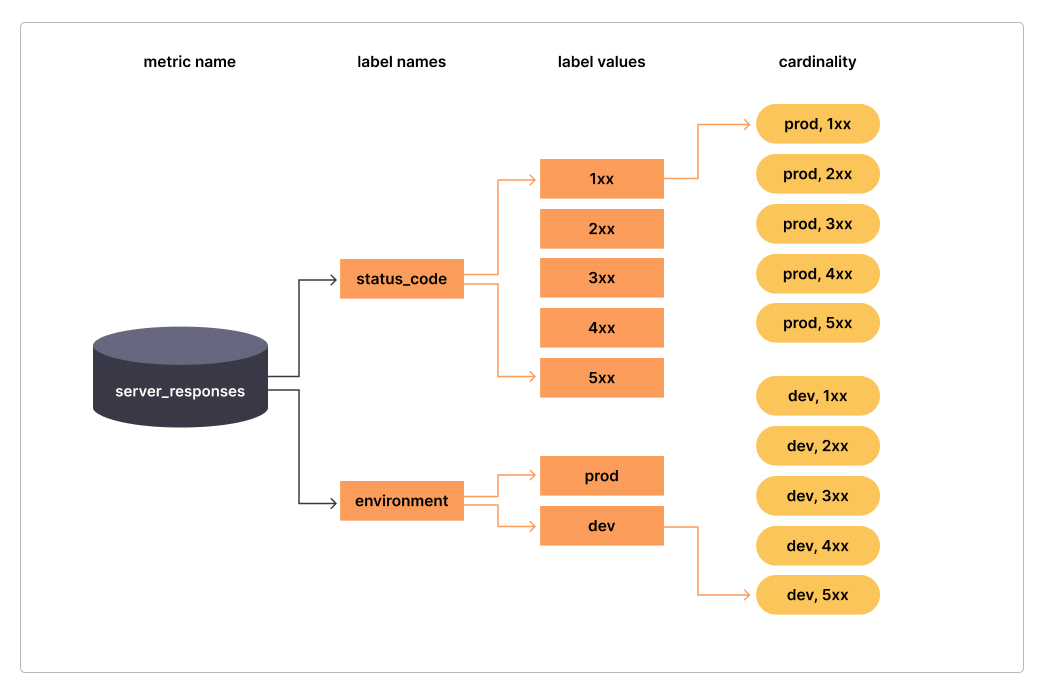
近期发现自己实验用的 Prometheus 性能出现瓶颈, 经常会出现如下告警: PrometheusMissingRuleEvaluations PrometheusRuleFailures之后慢慢排查发现是由于 Prometheus 的某些 series 的高基数(High Cardinality)导致的. 本文是对 Prometheus 高基数问题的一次全面总结. 什么是基数(Cardinality)?基数的基本定义是指一个给定集合中的元素的数量。 在Prometheus和可观察性的世界里,标签基数是非常重要的,因为它影响到你的监控系统的性能和资源使用。 下面这张图, 可以清晰地反应基数的重要性:
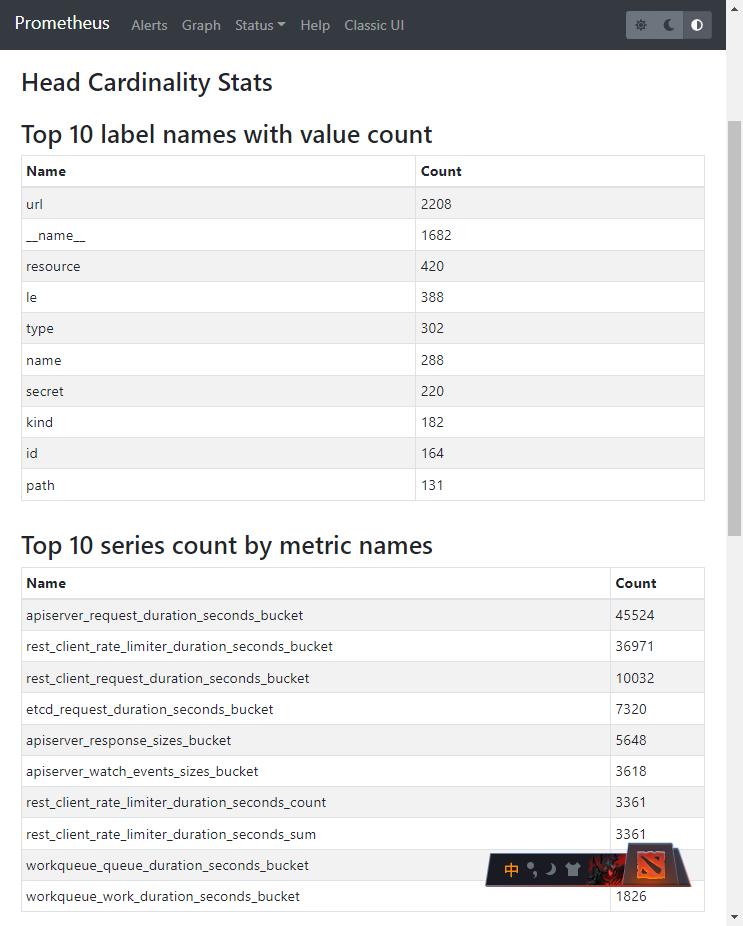
简单地说。基数 是指一个标签的总体数值的计数。在上面的例子中,标签status_code的基数是5,(即:1xx 2xx 3xx 4xx 5xx),environment的基数是2(即prod dev),而指标server_responses的总体基数是10。 多少算高基数?一般来说: 较低的基数 1:5的标签值比率, 标准基数 1:80的标签值比率 高基数 1:10000的标签值比率。还是上面的例子, 如果 status_code 是详细的code, 如200 404..., 那它的基数就可能高达数百个, environment的基数再多一些, 指标server_responses的总体基数就会迅速膨胀. 高基数的典型案例这还不够形象, 再举 2 个特别典型的例子: 有一个指标叫做: http_request_duration_seconds_bucket 它有 instance label, 对应 100 个实例; 有 le label, 对应的是不同的 buckets, 有 10 个 buckets, 如(0.002 0.004 0.008 ... =+inf) 它还有 url 这个 label, 对应的是不通的 url: 即使规模很小, url 可能也会有 400 个 url 这里还有个特别恐怖的隐患, 就是对于大规模系统来说, 这个 url 可能是近乎于无穷!!! 它还有 http_method 这个label, 对应有 5 个 http method 在这种情况下, 该指标的 label 小规模也会有: 100*10*400*5=2 000 000 200万个 series 💀💀💀 如果大规模, url 近乎无穷的话, 那么这个基数根本无法计算出来💥💥💥 再有一种情况, 将 user_id 甚至是 session_id 经纬度这种本来基数就很大, 甚至可能是无穷的参数设为 label, 那么对于 Prometheus 来说就是灾难了.💥💥💥 高基数的负面影响当 Prometheus 有高基数的时候,就会出现各种问题: 监控系统不稳定甚至崩溃 仪表板加载很慢甚至加载失败 监控查询很慢甚至失败 计算存储资源开销巨大 监控充斥着大量噪音干扰 SRE 团队不得不疲于应对海量的告警数据, 反而耽误 root cause 的分析定位📝Notes: 基数 与指标系列(metrics series) 的数量相对应。所以在这篇博文中,会把 series 的数量与基数交替提及。 如何分析高基数问题?分析高基数问题有以下方法: 使用 Prometheus UI 分析 使用 Prometheus PromQL 分析 使用 Prometheus API 分析 使用 Grafana Mimirtool 分析未使用的指标 使用 Prometheus UI 分析从 Prometheus v2.14.0 以后, 在 UI 上直接有 Head Cardinality Stats 这个菜单. 极大方便了我们进行高基数问题的分析! 👍️👍️👍️ 位于: Prometheus UI -> Status -> TSDB Status -> Head Cardinality Stats, 截图如下: 📝Notes: 以下截图的系统规模说明: 这就是个我用来做实验的环境, 只有 4 个 1c2g 的 node
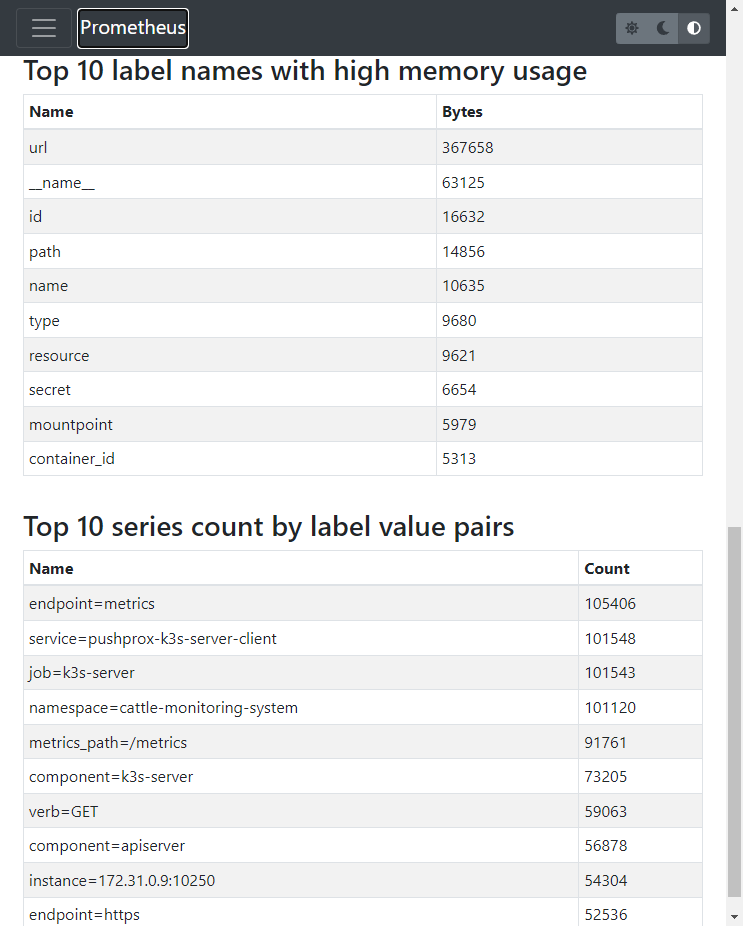
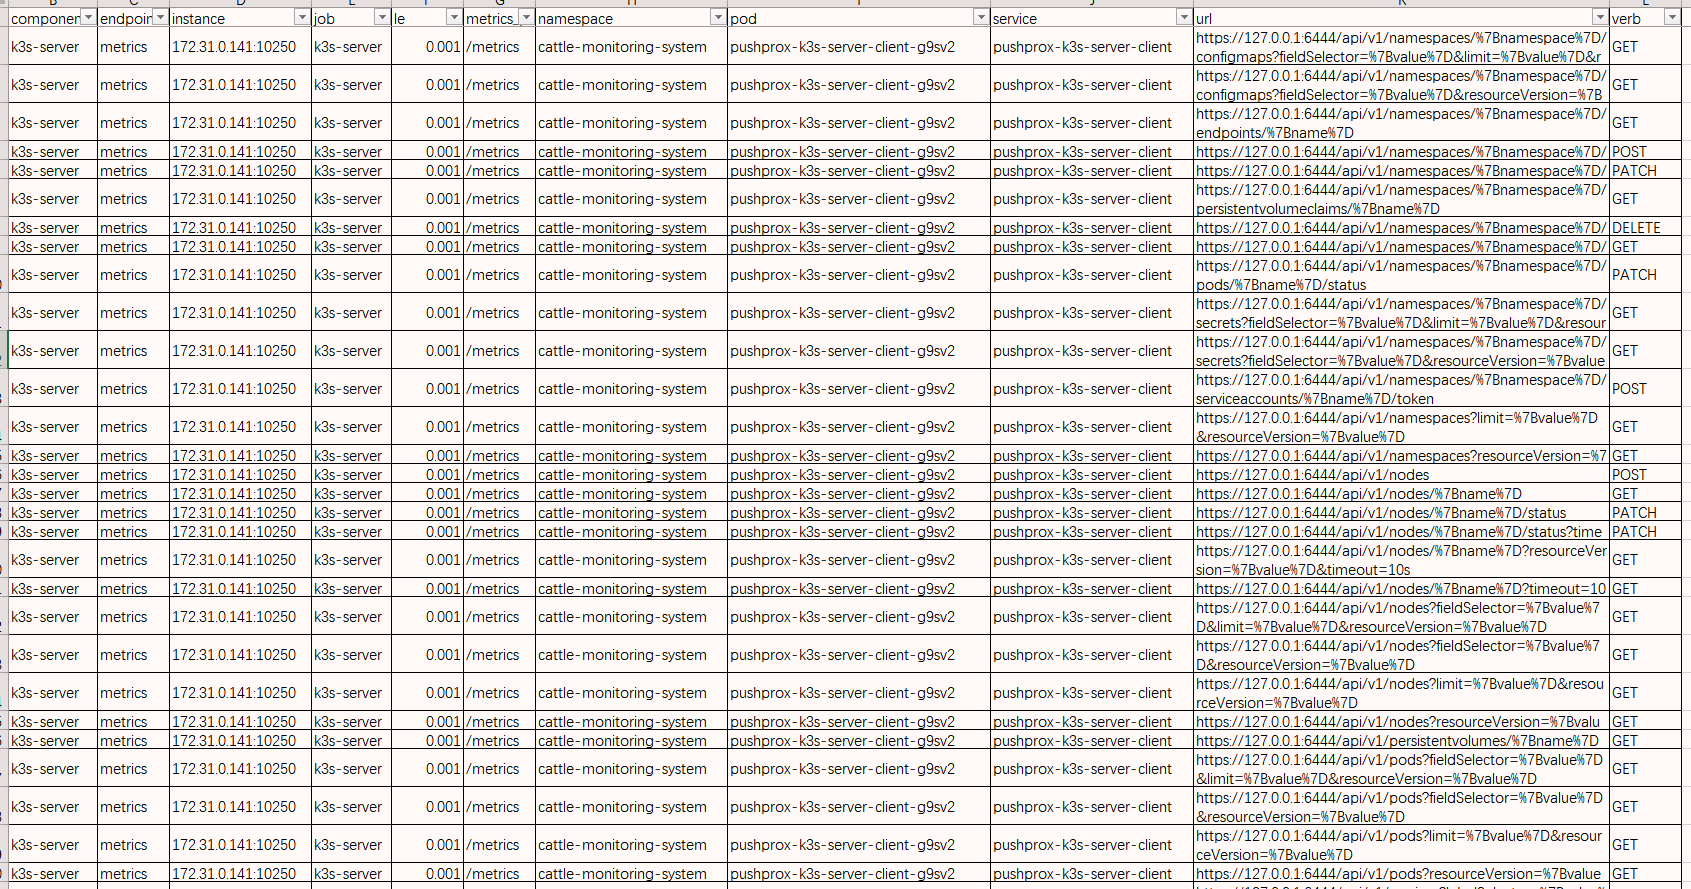
从上图可以直观看到: 值最多的 Label 是 url 最多的 series 的指标有: apiserver_request_duration_seconds_bucket 45524 rest_client_rate_limiter_duration_seconds_bucket 36971 rest_client_request_duration_seconds_bucket 10032 内存使用量最多的 Label: url 根据 Label 键值对匹配, series 最多的键值对有: (这一项目前对我来说用处不大) endpoint=metrics 105406 service=pushprox-k3s-server-client 101548 job=k3s-server 101543 namespace=cattle-monitoring-system 101120 metrics_path=/metrics 91761 使用 Prometheus PromQL 分析如果 Prometheus 版本低于 v2.14.0, 那就需要通过: Prometheus PromQL Prometheus API来进行分析. 以下提供一些实用的 PromQL: topk(10, count by (__name__)({__name__=~".+"})) 复制代码对应的查询结果就是上文的 series 指标最多的 Top10 知道了 Top10, 接下来可以进一步查询细节, 由于基数巨大, 如果查询 range 可能会一直失败, 所以推荐使用 instant 的方式查询细节. 如果要查询标签的维度, 可以执行如下 PromQL: count(count by (label_name) (metric_name)) 复制代码如: count(count by (url) (apiserver_request_duration_seconds_bucket)) 复制代码另外还有一些其他的 PromQL, 罗列如下: sum(scrape_series_added) by (job) 通过 job Label 分析 series 增长 sum(scrape_samples_scraped) by (job) 通过 job Label 分析 series 总量 prometheus_tsdb_symbol_table_size_bytes 使用 Prometheus API 分析因为高基数问题的特点, 所以通过 Prometheus PromQL 查询可能经常会超时或失败. 那么可以通过 Prometheus API 进行分析: 分析各个指标的 series 数量 # 找到 Prometheus 的 SVC ClusterIP kubectl get svc -n cattle-monitoring-system export url=http://10.43.85.24:9090 export now=$(date +%s) curl -s $url/api/v1/label/__name__/values \ | jq -r ".data[]" \ | while read metric; do count=$(curl -s \ --data-urlencode 'query=count({__name__="'$metric'"})' \ --data-urlencode "time=$now" \ $url/api/v1/query \ | jq -r ".data.result[0].value[1]") echo "$count $metric" done 复制代码我自己的实验集群分析结果 top 如下: (null 可能是当前没有数据, 但历史数据量可能会很大) 活动 series 数量指标名称nullapiserver_admission_webhook_rejection_countnullapiserver_registered_watchersnullapiserver_request_aborts_totalnullapiserver_request_duration_seconds_bucketnullcluster_quantile:scheduler_e2e_scheduling_duration_seconds:histogram_quantilenullcluster_quantile:scheduler_scheduling_algorithm_duration_seconds:histogram_quantilenullkube_pod_container_status_waiting_reasonnullprometheus_target_scrape_pool_target_limitnullrest_client_rate_limiter_duration_seconds_bucket5786rest_client_request_duration_seconds_bucket3660etcd_request_duration_seconds_bucket2938rest_client_rate_limiter_duration_seconds_count2938rest_client_rate_limiter_duration_seconds_sum2840apiserver_response_sizes_bucket1809apiserver_watch_events_sizes_bucket 获取指定指标的活动 series这里以 rest_client_request_duration_seconds_bucket 为例: export metric=rest_client_request_duration_seconds_bucket curl -s \ --data-urlencode "query=$metric" \ --data-urlencode "time=$now" \ $url/api/v1/query \ | jq -c ".data.result[].metric" 复制代码结果如下: (主要原因就是 url 的 value 太多)
结果如下: (还是因为 label url 的value 过多! ) 基数标签2199url1706__name__854name729id729path657filename652container_id420resource407le351secret302type182kind 使用 Grafana Mimirtool 分析未使用的指标📚️Reference: Grafana Mimirtool | Grafana Mimir documentation Grafana Mimir 的介绍具体见这里: Intro to Grafana Mimir: The open source time series database that scales to 1 billion metrics & beyond | Grafana Labs Mimir 有个实用工具叫 mimirtool, 可以通过对比 Prometheus 的指标, 和 AlertManager 以及 Grafana 用到的指标, 来分析哪些指标没有用到. 可以通过如下输入进行分析: Grafana 实例的 Grafana Dashboards Prometheus 实例的 recording rules 和 alerting rules Grafana Dashboard json 文件 Prometheus recording 和 alerting rules YAML 文件这里就不做详细介绍, 完整介绍见这里: Analyzing and reducing metrics usage with Grafana Mimirtool | Grafana Cloud documentation 解决高基数问题对于高基数问题, 有几种情况: 某些 label 不合理, 值很多甚至无穷; 某些 指标 不合理, 值很多; Prometheus 整体的全部 series 量太大对于第三个问题, 以下 2 个办法可以解决: 对于高可用 Prometheus的高基数问题有一种高基数的情况, 是 Prometheus 以 HA 模式部署, 并且通过 remote_write 方式将数据发送到 VM、Mimir 或 Thanos.导致数据冗余。 针对这种情况,可以根据 VM、Mimir 或 Thanos 官方文档的指导,添加 external_labels 供这些软件自动处理高基数问题. 示例配置如下: 增加external_labels cluster __replicas__ 增大采集间隔增加 Prometheus 的 global scrape_interval(调整全局的该参数, 对于某些确实需要更小采集间隔的, 可以在 job 内详细配置) 一般可能默认是 scrape_interval: 15s 建议将其增大值调整为 scrape_interval: 1m 甚至更大. 过滤和保留 kubernetes-mixin 指标对于 kubernetes-mixin、Prometheus Operator、kube-prometheus 等项目,都会提供一些开箱即用的: scrape metrics recording rules alerting rules Grafana Dashboards对于这种情况, 根据对于 Grafana Dashboards 和 alerting rules,可以通过 relabel 保留用到的指标。 📚️Reference: 「译文」通过 Relabel 减少 Prometheus 指标的使用量 - 东风微鸣技术博客 (ewhisper.cn) 示例如下: remoteWrite: - url: "" basicAuth: username: name: your_grafanacloud_secret key: your_grafanacloud_secret_username_key password: name: your_grafanacloud_secret key: your_grafanacloud_secret_password_key writeRelabelConfigs: - sourceLabels: - "__name__" regex: "apiserver_request_total|kubelet_node_config_error|kubelet_runtime_operations_errors_total|kubeproxy_network_programming_duration_seconds_bucket|container_cpu_usage_seconds_total|kube_statefulset_status_replicas|kube_statefulset_status_replicas_ready|node_namespace_pod_container:container_memory_swap|kubelet_runtime_operations_total|kube_statefulset_metadata_generation|node_cpu_seconds_total|kube_pod_container_resource_limits_cpu_cores|node_namespace_pod_container:container_memory_cache|kubelet_pleg_relist_duration_seconds_bucket|scheduler_binding_duration_seconds_bucket|container_network_transmit_bytes_total|kube_pod_container_resource_requests_memory_bytes|namespace_workload_pod:kube_pod_owner:relabel|kube_statefulset_status_observed_generation|process_resident_memory_bytes|container_network_receive_packets_dropped_total|kubelet_running_containers|kubelet_pod_worker_duration_seconds_bucket|scheduler_binding_duration_seconds_count|scheduler_volume_scheduling_duration_seconds_bucket|workqueue_queue_duration_seconds_bucket|container_network_transmit_packets_total|rest_client_request_duration_seconds_bucket|node_namespace_pod_container:container_memory_rss|container_cpu_cfs_throttled_periods_total|kubelet_volume_stats_capacity_bytes|kubelet_volume_stats_inodes_used|cluster_quantile:apiserver_request_duration_seconds:histogram_quantile|kube_node_status_allocatable_memory_bytes|container_memory_cache|go_goroutines|kubelet_runtime_operations_duration_seconds_bucket|kube_statefulset_replicas|kube_pod_owner|rest_client_requests_total|container_memory_swap|node_namespace_pod_container:container_memory_working_set_bytes|storage_operation_errors_total|scheduler_e2e_scheduling_duration_seconds_bucket|container_network_transmit_packets_dropped_total|kube_pod_container_resource_limits_memory_bytes|node_namespace_pod_container:container_cpu_usage_seconds_total:sum_rate|storage_operation_duration_seconds_count|node_netstat_TcpExt_TCPSynRetrans|node_netstat_Tcp_OutSegs|container_cpu_cfs_periods_total|kubelet_pod_start_duration_seconds_count|kubeproxy_network_programming_duration_seconds_count|container_network_receive_bytes_total|node_netstat_Tcp_RetransSegs|up|storage_operation_duration_seconds_bucket|kubelet_cgroup_manager_duration_seconds_count|kubelet_volume_stats_available_bytes|scheduler_scheduling_algorithm_duration_seconds_bucket|kube_statefulset_status_replicas_current|code_resource:apiserver_request_total:rate5m|kube_statefulset_status_replicas_updated|process_cpu_seconds_total|kube_pod_container_resource_requests_cpu_cores|kubelet_pod_worker_duration_seconds_count|kubelet_cgroup_manager_duration_seconds_bucket|kubelet_pleg_relist_duration_seconds_count|kubeproxy_sync_proxy_rules_duration_seconds_bucket|container_memory_usage_bytes|workqueue_adds_total|container_network_receive_packets_total|container_memory_working_set_bytes|kube_resourcequota|kubelet_running_pods|kubelet_volume_stats_inodes|kubeproxy_sync_proxy_rules_duration_seconds_count|scheduler_scheduling_algorithm_duration_seconds_count|apiserver_request:availability30d|container_memory_rss|kubelet_pleg_relist_interval_seconds_bucket|scheduler_e2e_scheduling_duration_seconds_count|scheduler_volume_scheduling_duration_seconds_count|workqueue_depth|:node_memory_MemAvailable_bytes:sum|volume_manager_total_volumes|kube_node_status_allocatable_cpu_cores" action: "keep" 复制代码🐾Warning: 以上配置可能根据不同的版本, 会有不同的变化, 请酌情参考使用. 或者根据上文提到的 mimirtool 自行分析生成适合自己的配置. 通过 Relabel 减少 Prometheus 指标的使用量举一个简单例子如下: write_relabel_configs: - source_labels: [__name__] regex: "apiserver_request_duration_seconds_bucket" action: drop 复制代码 通过 recording rules 聚合指标并和 relabel drop 结合使用比如对于 apiserver_request_duration_seconds_bucket, 我需要的是一些高纬度的指标 - 如 API Server 的可用率, 那么这些指标可以通过 recording rules 进行记录和存储, 示例如下: groups: - interval: 3m name: kube-apiserver-availability.rules rules: - expr: >- avg_over_time(code_verb:apiserver_request_total:increase1h[30d]) * 24 * 30 record: code_verb:apiserver_request_total:increase30d - expr: >- sum by (cluster, code, verb) (increase(apiserver_request_total{job="apiserver",verb=~"LIST|GET|POST|PUT|PATCH|DELETE",code=~"2.."}[1h])) record: code_verb:apiserver_request_total:increase1h - expr: >- sum by (cluster, code, verb) (increase(apiserver_request_total{job="apiserver",verb=~"LIST|GET|POST|PUT|PATCH|DELETE",code=~"5.."}[1h])) record: code_verb:apiserver_request_total:increase1h 复制代码之后可以再在 remote_wirte 等阶段删掉原始指标: write_relabel_configs: - source_labels: [__name__] regex: "apiserver_request_duration_seconds_bucket" action: drop 复制代码💪💪💪 📚️参考文档 How to manage high cardinality metrics in a Prometheus environment (grafana.com) What are cardinality spikes and why do they matter? | Grafana Labs Containing your Cardinality Control Prometheus metrics usage | Grafana Cloud documentation Bomb Squad: Automatic Detection and Suppression of Prometheus Cardinality Explosions | by Cody Boggs | FreshTracks.io Feature: Expose a request path label in the http_request_* metric by default · Issue #491 · prometheus/client_golang · GitHub三人行, 必有我师; 知识共享, 天下为公. 本文由东风微鸣技术博客 EWhisper.cn 编写. |
【本文地址】
今日新闻 |
点击排行 |
|
推荐新闻 |
图片新闻 |
|
专题文章 |