使用 GPU |
您所在的位置:网站首页 › gpu资源调度框架有哪些 › 使用 GPU |
使用 GPU
本文将从 GPU-Operator 概念介绍、安装部署、深度训练测试应用部署,以及在 KubeSphere 使用自定义监控面板对接 GPU 监控,从原理到实践,逐步浅析介绍与实践 GPU-Operator。 GPU-Operator简介众所周知,Kubernetes 平台通过设备插件框架提供对特殊硬件资源的访问,如 NVIDIA GPU、网卡、Infiniband 适配器和其他设备。然而,使用这些硬件资源配置和管理节点需要配置多个软件组件,如驱动程序、容器运行时或其他依赖库,这是比较困难的和容易出错的。 NVIDIA GPU Operator 由 Nvidia 公司开源,利用了 Kubernetes 的 Operator 控制模式,方便地自动化集成管理 GPU 所需的 NVIDIA 设备组件,有效地解决了上述GPU设备集成的痛点。这些组件包括 NVIDIA 驱动程序(用于启用 CUDA )、用于 GPU 的 Kubernetes 设备插件、NVIDIA Container 运行时、自动节点标签、基于 DCGM 的监控等。 NVIDIA GPU Operator 的不仅实现了设备和组件一体化集成,而且它管理 GPU 节点就像管理 CPU 节点一样方便,无需单独为 GPU 节点提供特殊的操作系统。值得关注的是,它将 GPU 各组件容器化,提供 GPU 能力,非常适合快速扩展和管理规模 GPU 节点。当然,对于已经为 GPU 组件构建了特殊操作系统的应用场景来说,显得并不是那么合适了。 GPU-Operator 架构原理前文提到,NVIDIA GPU Operator 管理 GPU 节点就像管理 CPU 节点一样方便,那么它是如何实现这一能力呢? 我们一起来看看 GPU-Operator 运行时的架构图:
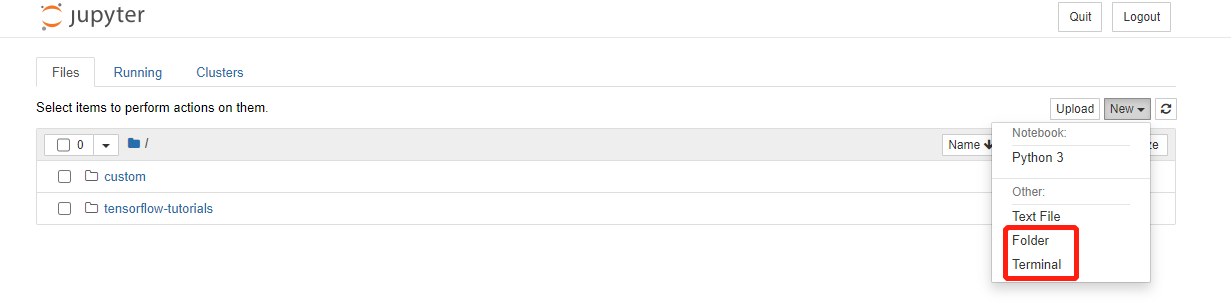
通过图中的描述,我们可以知道, GPU-Operator 是通过实现了 Nvidia 容器运行时,以runC作为输入,在runC中preStart hook中注入了一个名叫nvidia-container-toolkit的脚本,该脚本调用libnvidia-container CLI设置一系列合适的flags,使得容器运行后具有 GPU 能力。 GPU-Operator 安装说明前提条件在安装 GPU Operator 之前,请配置好安装环境如下: 所有节点不需要预先安装NVIDIA组件(driver,container runtime,device plugin);所有节点必须配置Docker,cri-o, 或者containerd.对于 docker 来说,可以参考这里;如果使用HWE内核(e.g. kernel 5.x) 的 Ubuntu 18.04 LTS 环境下,需要给nouveau driver添加黑名单,需要更新initramfs;$ sudo vim /etc/modprobe.d/blacklist.conf # 在尾部添加黑名单 blacklist nouveau options nouveau modeset=0 $ sudo update-initramfs -u $ reboot $ lsmod | grep nouveau # 验证nouveau是否已禁用 $ cat /proc/cpuinfo | grep name | cut -f2 -d: | uniq -c #本文测试时处理器架构代号为Broadwell 16 Intel Core Processor (Broadwell) 节点发现(NFD) 需要在每个节点上配置,默认情况会直接安装,如果已经配置,请在Helm chart变量设置nfd.enabled为false, 再安装;如果使用 Kubernetes 1.13和1.14, 需要激活 KubeletPodResources;支持的linux版本OS Name / VersionIdentifieramd64 / x86_64ppc64learm64 / aarch64Amazon Linux 1amzn1XAmazon Linux 2amzn2XAmazon Linux 2017.09amzn2017.09XAmazon Linux 2018.03amzn2018.03XOpen Suse Leap 15.0sles15.0XOpen Suse Leap 15.1sles15.1XDebian Linux 9debian9XDebian Linux 10debian10XCentos 7centos7XXCentos 8centos8XXXRHEL 7.4rhel7.4XXRHEL 7.5rhel7.5XXRHEL 7.6rhel7.6XXRHEL 7.7rhel7.7XXRHEL 8.0rhel8.0XXXRHEL 8.1rhel8.1XXXRHEL 8.2rhel8.2XXXUbuntu 16.04ubuntu16.04XXUbuntu 18.04ubuntu18.04XXXUbuntu 20.04ubuntu20.04XXX支持的容器运行时OS Name / Versionamd64 / x86_64ppc64learm64 / aarch64Docker 18.09XXXDocker 19.03XXXRHEL/CentOS 8 podmanXCentOS 8 DockerXRHEL/CentOS 7 DockerX安装doker环境可参考 Docker 官方文档 安装NVIDIA Docker配置 stable 仓库和 GPG key : $ distribution=$(. /etc/os-release;echo $ID$VERSION_ID) \ && curl -s -L https://nvidia.github.io/nvidia-docker/gpgkey | sudo apt-key add - \ && curl -s -L https://nvidia.github.io/nvidia-docker/$distribution/nvidia-docker.list | sudo tee /etc/apt/sources.list.d/nvidia-docker.list更新软件仓库后安装nvidia-docker2并添加运行时配置: $ sudo apt-get update $ sudo apt-get install -y nvidia-docker2 ----- What would you like to do about it ? Your options are: Y or I : install the package maintainer's version N or O : keep your currently-installed version D : show the differences between the versions Z : start a shell to examine the situation ----- # 初次安装,遇到以上交互式问题可选择N # 如果选择Y会覆盖你的一些默认配置 # 选择N后,将以下配置添加到etc/docker/daemon.json { "runtimes": { "nvidia": { "path": "/usr/bin/nvidia-container-runtime", "runtimeArgs": [] } } }重启docker: $ sudo systemctl restart docker 安装Helm$ curl -fsSL -o get_helm.sh https://raw.githubusercontent.com/helm/helm/master/scripts/get-helm-3 \ && chmod 700 get_helm.sh \ && ./get_helm.sh添加helm仓库 $ helm repo add nvidia https://nvidia.github.io/gpu-operator \ && helm repo update 安装 NVIDIA GPU Operator不同的容器运行时安装方法稍有区别: docker as runtime$ kubectl create ns gpu-operator-resources $ helm install gpu-operator nvidia/gpu-operator -n gpu-operator-resources --wait如果需要指定驱动版本,可参考如下: $ helm install gpu-operator nvidia/gpu-operator -n gpu-operator-resources \ --set driver.version="450.80.02" crio as runtimehelm install gpu-operator nvidia/gpu-operator -n gpu-operator-resources\ --set operator.defaultRuntime=crio containerd as runtimehelm install gpu-operator nvidia/gpu-operator -n gpu-operator-resources\ --set operator.defaultRuntime=containerd Furthermore, when setting containerd as the defaultRuntime the following options are also available: toolkit: env: - name: CONTAINERD_CONFIG value: /etc/containerd/config.toml - name: CONTAINERD_SOCKET value: /run/containerd/containerd.sock - name: CONTAINERD_RUNTIME_CLASS value: nvidia - name: CONTAINERD_SET_AS_DEFAULT value: true由于安装的镜像比较大,所以初次安装过程中可能会出现超时的情形,请检查你的镜像是否在拉取中!可以考虑使用离线安装解决该类问题 使用 values.yaml 安装$ helm install gpu-operator nvidia/gpu-operator -n gpu-operator-resources -f values.yaml 应用部署检查已部署 Operator 服务状态检查 Pods 状态$ kubectl get pods -n gpu-operator-resources NAME READY STATUS RESTARTS AGE gpu-feature-discovery-4gk78 1/1 Running 0 35s gpu-operator-858fc55fdb-jv488 1/1 Running 0 2m52s gpu-operator-node-feature-discovery-master-7f9ccc4c7b-2sg6r 1/1 Running 0 2m52s gpu-operator-node-feature-discovery-worker-cbkhn 1/1 Running 0 2m52s gpu-operator-node-feature-discovery-worker-m8jcm 1/1 Running 0 2m52s nvidia-container-toolkit-daemonset-tfwqt 1/1 Running 0 2m42s nvidia-dcgm-exporter-mqns5 1/1 Running 0 38s nvidia-device-plugin-daemonset-7npbs 1/1 Running 0 53s nvidia-device-plugin-validation 0/1 Completed 0 49s nvidia-driver-daemonset-hgv6s 检查节点资源是否处于可分配$ kubectl describe node worker-gpu-001 --- Allocatable: cpu: 15600m ephemeral-storage: 82435528Ki hugepages-2Mi: 0 memory: 63649242267 nvidia.com/gpu: 1 #check here pods: 110 --- 部署 Nvidia 文档的两个深度训练测试实例实例一$ cat cuda-load-generator.yaml apiVersion: v1 kind: Pod metadata: name: dcgmproftester spec: restartPolicy: OnFailure containers: - name: dcgmproftester11 image: nvidia/samples:dcgmproftester-2.0.10-cuda11.0-ubuntu18.04 args: ["--no-dcgm-validation", "-t 1004", "-d 120"] resources: limits: nvidia.com/gpu: 1 securityContext: capabilities: add: ["SYS_ADMIN"] EOF 实例二$ curl -LO https://nvidia.github.io/gpu-operator/notebook-example.yml $ cat notebook-example.yml apiVersion: v1 kind: Service metadata: name: tf-notebook labels: app: tf-notebook spec: type: NodePort ports: - port: 80 name: http targetPort: 8888 nodePort: 30001 selector: app: tf-notebook --- apiVersion: v1 kind: Pod metadata: name: tf-notebook labels: app: tf-notebook spec: securityContext: fsGroup: 0 containers: - name: tf-notebook image: tensorflow/tensorflow:latest-gpu-jupyter resources: limits: nvidia.com/gpu: 1 ports: - containerPort: 8 基于 Jupyter Notebook 应用运行深度学习训练任务部署 cuda 与 notebook 示例应用$ kubectl apply -f cuda-load-generator.yaml pod/dcgmproftester created $ kubectl apply -f notebook-example.yml service/tf-notebook created pod/tf-notebook created 查看 GPU 处于已分配状态:$ kubectl describe node worker-gpu-001 --- Allocated resources: (Total limits may be over 100 percent, i.e., overcommitted.) Resource Requests Limits -------- -------- ------ cpu 1087m (6%) 1680m (10%) memory 1440Mi (2%) 1510Mi (2%) ephemeral-storage 0 (0%) 0 (0%) nvidia.com/gpu 1 1 #check this Events:当有 GPU 任务发布给平台时,GPU 资源从可分配状态转变为已分配状态,安装任务发布的先后顺序,第二个任务在第一个任务运行结束后开始运行: $ kubectl get pods --watch NAME READY STATUS RESTARTS AGE dcgmproftester 1/1 Running 0 76s tf-notebook 0/1 Pending 0 58s ------ NAME READY STATUS RESTARTS AGE dcgmproftester 0/1 Completed 0 4m22s tf-notebook 1/1 Running 0 4m4s获取应用端口信息: $ kubectl get svc # get the nodeport of the svc, 30001 gpu-operator-1611672791-node-feature-discovery ClusterIP 10.233.10.222 8080/TCP 12h kubernetes ClusterIP 10.233.0.1 443/TCP 12h tf-notebook NodePort 10.233.53.116 80:30001/TCP 7m52s查看日志,获取登录口令: $ kubectl logs tf-notebook [I 21:50:23.188 NotebookApp] Writing notebook server cookie secret to /root/.local/share/jupyter/runtime/notebook_cookie_secret [I 21:50:23.390 NotebookApp] Serving notebooks from local directory: /tf [I 21:50:23.391 NotebookApp] The Jupyter Notebook is running at: [I 21:50:23.391 NotebookApp] http://tf-notebook:8888/?token=3660c9ee9b225458faaf853200bc512ff2206f635ab2b1d9 [I 21:50:23.391 NotebookApp] or http://127.0.0.1:8888/?token=3660c9ee9b225458faaf853200bc512ff2206f635ab2b1d9 [I 21:50:23.391 NotebookApp] Use Control-C to stop this server and shut down all kernels (twice to skip confirmation). [C 21:50:23.394 NotebookApp] To access the notebook, open this file in a browser: file:///root/.local/share/jupyter/runtime/nbserver-1-open.html Or copy and paste one of these URLs: http://tf-notebook:8888/?token=3660c9ee9b225458faaf853200bc512ff2206f635ab2b1d9 or http://127.0.0.1:8888/?token=3660c9ee9b225458faaf853200bc512ff2206f635ab2b1d9通过查看应用的日志,我们拿到登录口令后,就可以顺利进入 notebook 开发环境: http:://:30001/?token=3660c9ee9b225458faaf853200bc512ff2206f635ab2b1d9 运行深度学习任务进入jupyter notebook 环境后,尝试进入终端,运行深度学习任务:
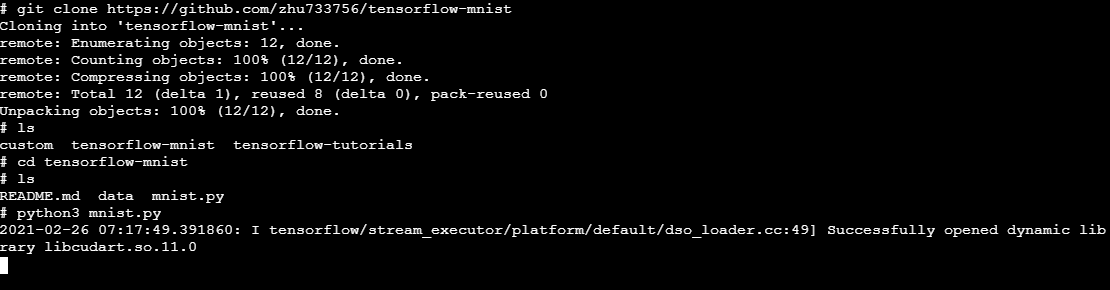
进入terminal后拉取tersorflow测试代码并运行:
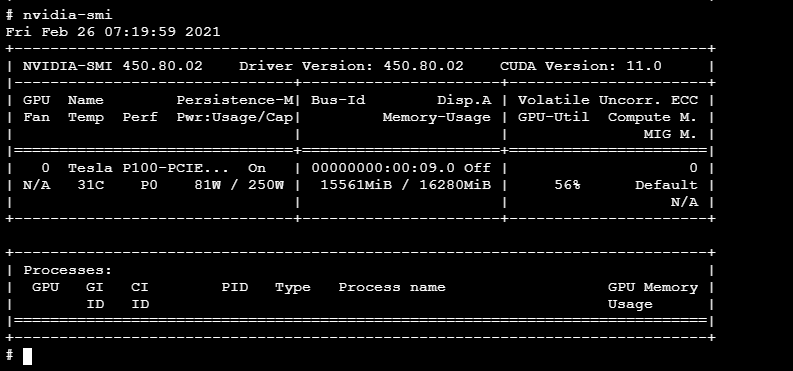
与此同时,开启另外一个终端运行nvidia-smi查看 GPU 监控使用情况:
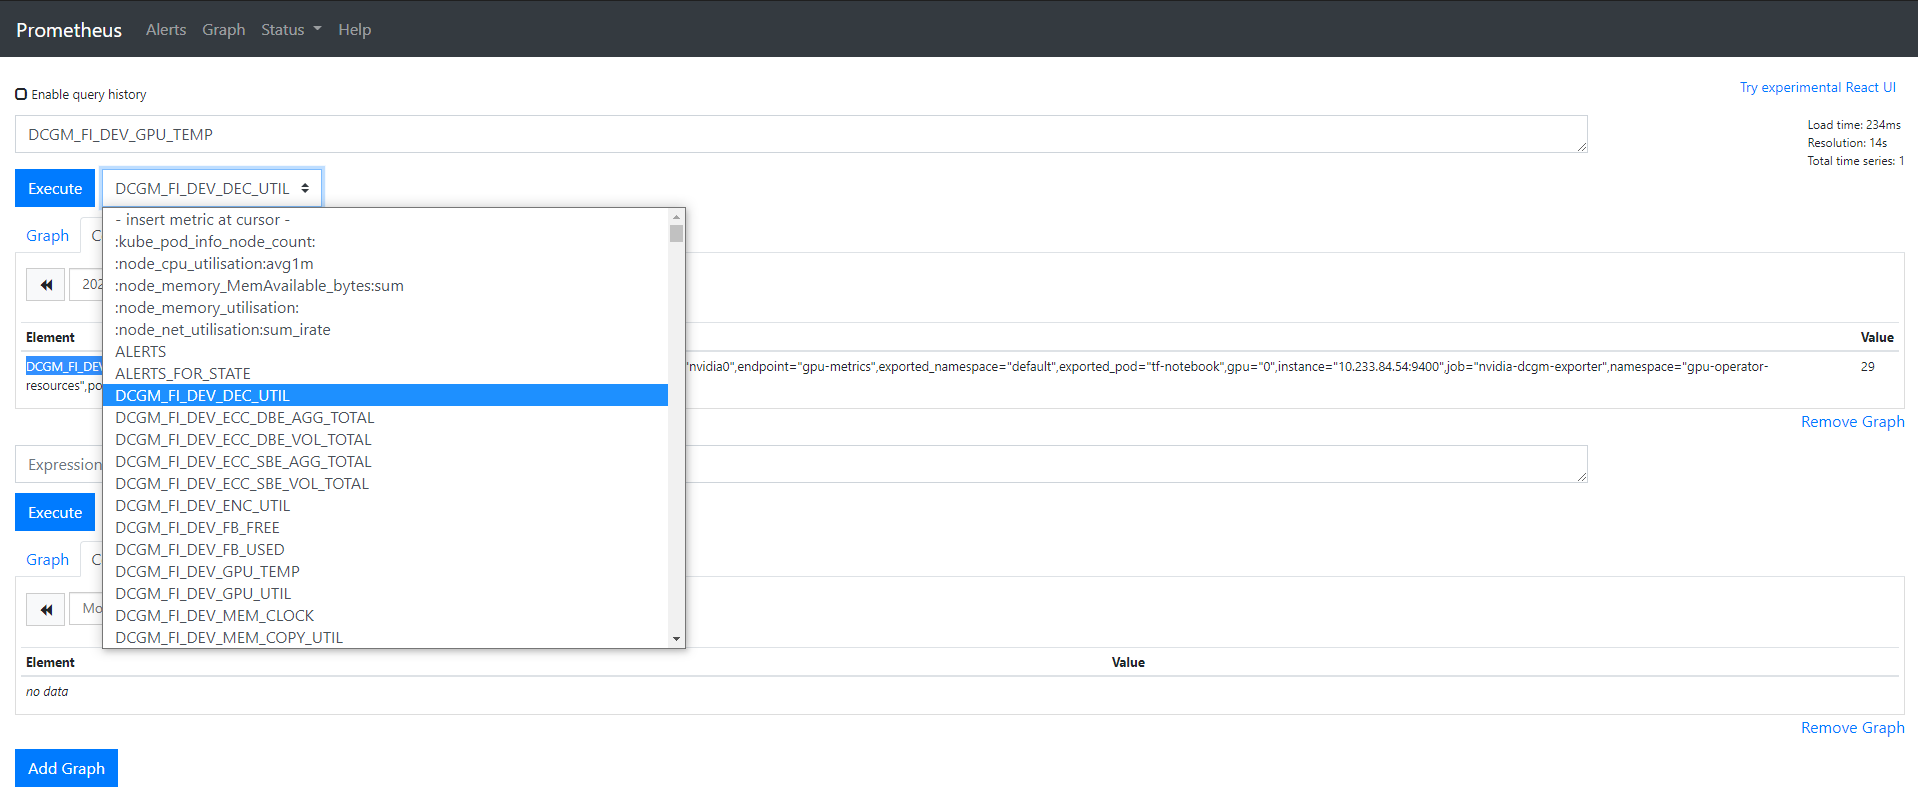
gpu-operator帮我们提供了nvidia-dcgm-exporter这个exportor, 只需要将它集成到Prometheus的可采集对象中,也就是ServiceMonitor中,我们就能获取GPU监控数据了: $ kubectl get pods -n gpu-operator-resources NAME READY STATUS RESTARTS AGE gpu-feature-discovery-ff4ng 1/1 Running 2 15h nvidia-container-toolkit-daemonset-2vxjz 1/1 Running 0 15h nvidia-dcgm-exporter-pqwfv 1/1 Running 0 5h27m #here nvidia-device-plugin-daemonset-42n74 1/1 Running 0 5h27m nvidia-device-plugin-validation 0/1 Completed 0 5h27m nvidia-driver-daemonset-dvd9r 1/1 Running 3 15h可以构建一个busybox查看该exporter暴露的指标: $ kubectl get svc -n gpu-operator-resources NAME TYPE CLUSTER-IP EXTERNAL-IP PORT(S) AGE gpu-operator-node-feature-discovery ClusterIP 10.233.54.111 8080/TCP 56m nvidia-dcgm-exporter ClusterIP 10.233.53.196 9400/TCP 54m $ kubectl exec -it busybox-sleep -- sh $ wget http://nvidia-dcgm-exporter.gpu-operator-resources:9400/metrics $ cat metrics ---- DCGM_FI_DEV_SM_CLOCK{gpu="0",UUID="GPU-eeff7856-475a-2eb7-6408-48d023d9dd28",device="nvidia0",container="tf-notebook",namespace="default",pod="tf-notebook"} 405 DCGM_FI_DEV_MEM_CLOCK{gpu="0",UUID="GPU-eeff7856-475a-2eb7-6408-48d023d9dd28",device="nvidia0",container="tf-notebook",namespace="default",pod="tf-notebook"} 715 DCGM_FI_DEV_GPU_TEMP{gpu="0",UUID="GPU-eeff7856-475a-2eb7-6408-48d023d9dd28",device="nvidia0",container="tf-notebook",namespace="default",pod="tf-notebook"} 30 ----查看nvidia-dcgm-exporter暴露的svc和ep: $ kubectl describe svc nvidia-dcgm-exporter -n gpu-operator-resources Name: nvidia-dcgm-exporter Namespace: gpu-operator-resources Labels: app=nvidia-dcgm-exporter Annotations: prometheus.io/scrape: true Selector: app=nvidia-dcgm-exporter Type: NodePort IP: 10.233.28.200 Port: gpu-metrics 9400/TCP TargetPort: 9400/TCP NodePort: gpu-metrics 31129/TCP Endpoints: 10.233.84.54:9400 Session Affinity: None External Traffic Policy: Cluster Events:配置ServiceMonitor定义清单: $ cat custom/gpu-servicemonitor.yaml apiVersion: monitoring.coreos.com/v1 kind: ServiceMonitor metadata: name: nvidia-dcgm-exporter namespace: gpu-operator-resources labels: app: nvidia-dcgm-exporter spec: jobLabel: nvidia-gpu endpoints: - port: gpu-metrics interval: 15s selector: matchLabels: app: nvidia-dcgm-exporter namespaceSelector: matchNames: - gpu-operator-resources $ kubectl apply -f custom/gpu-servicemonitor.yaml 检查 GPU 指标是否被采集到(可选)将servicemonitor提交给kubesphere平台后,通过暴露prometheus-k8s为NodePort,我们可以在Prometheus的UI上验证一下是否采集到的相关指标:
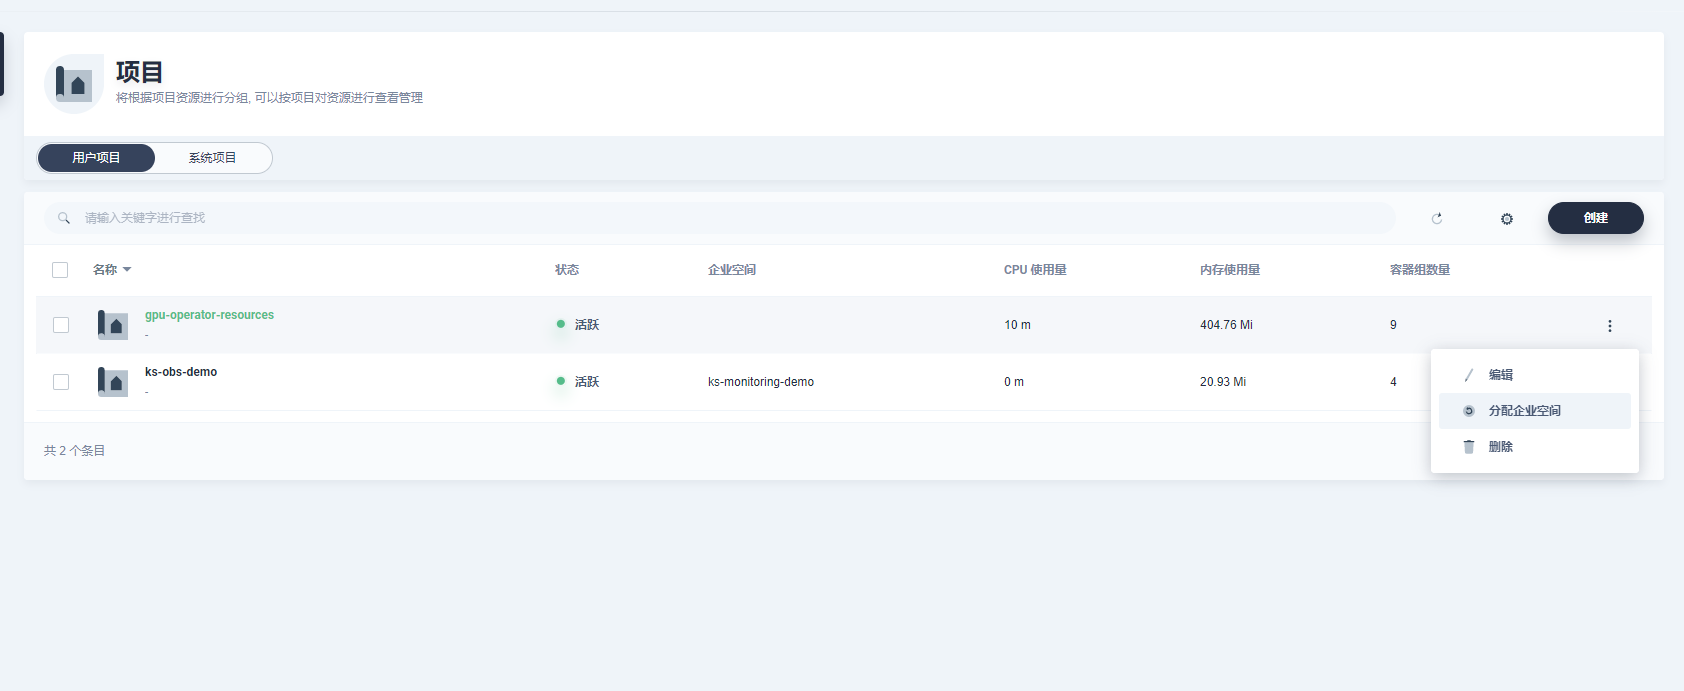
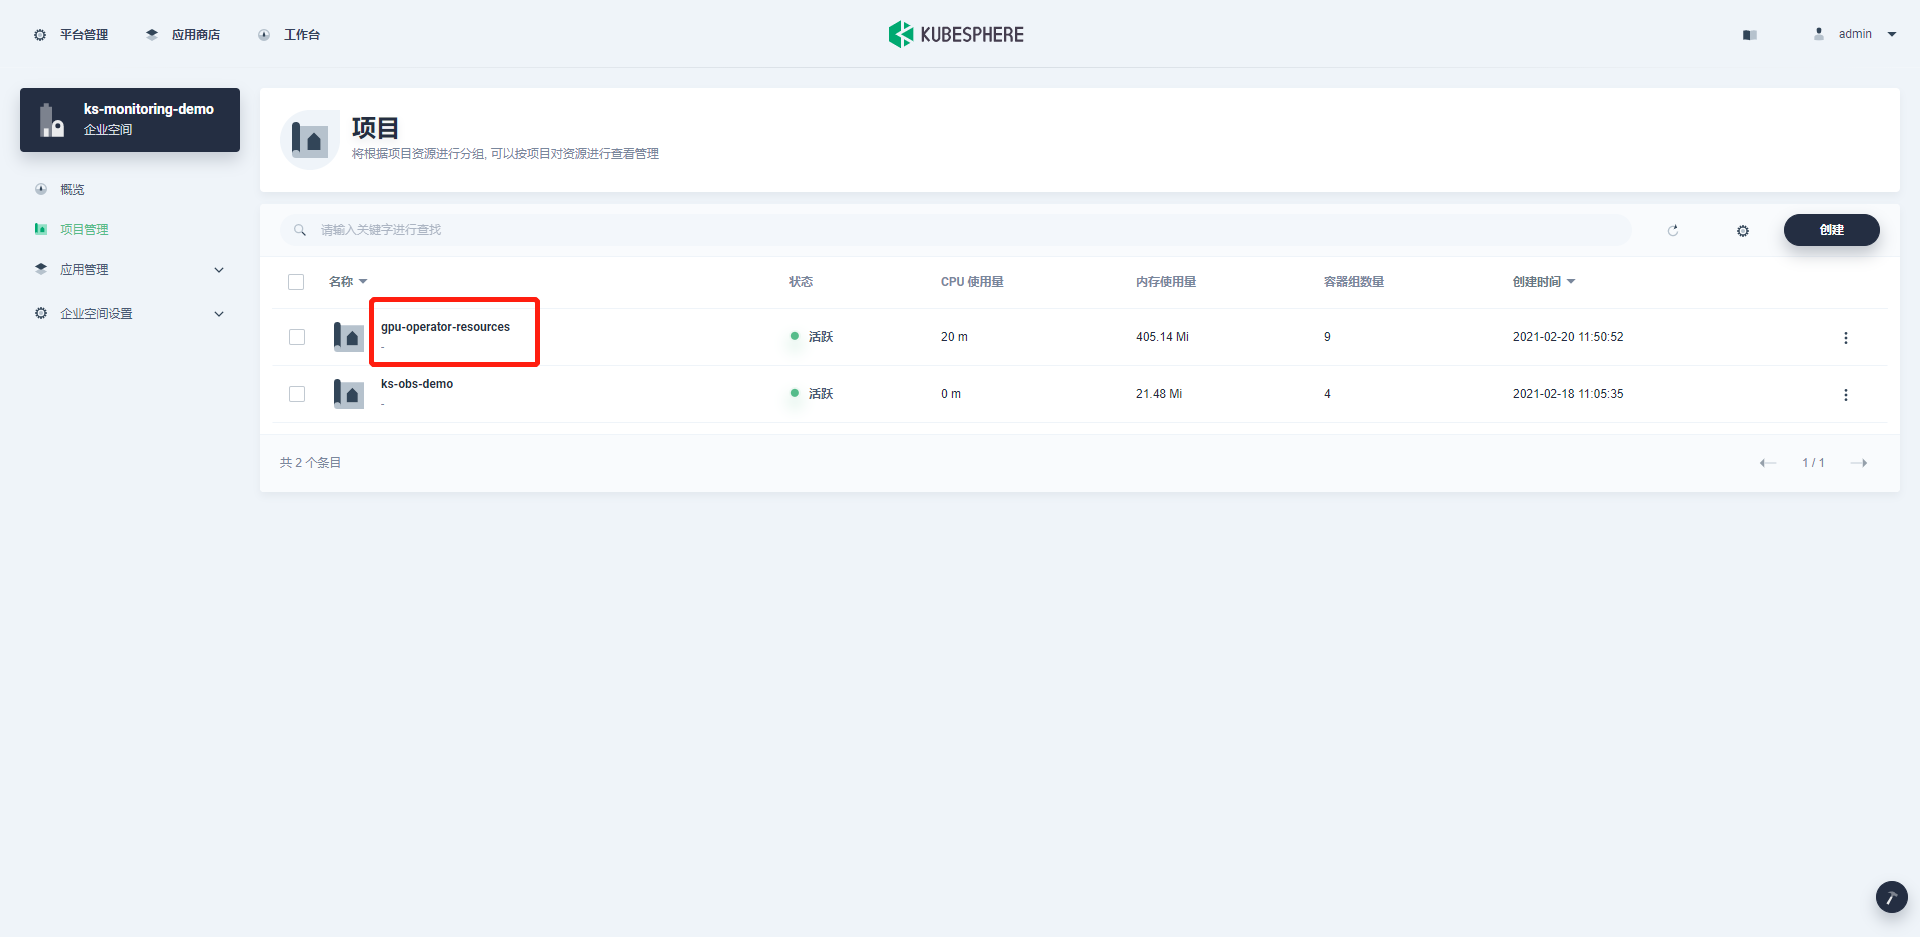
如果部署的 KubeSphere 版本是KubeSphere 3.0,需要简单地配置以下几个步骤,便可顺利完成可观测性监控。 首先, 登录kubsphere console后,创建一个企业空间名称为ks-monitoring-demo, 名称可按需创建; 其次,需要将ServiceMonitor所在的目标名称空间gpu-operator-resources分配为已存在的企业空间中,以便纳入监控。
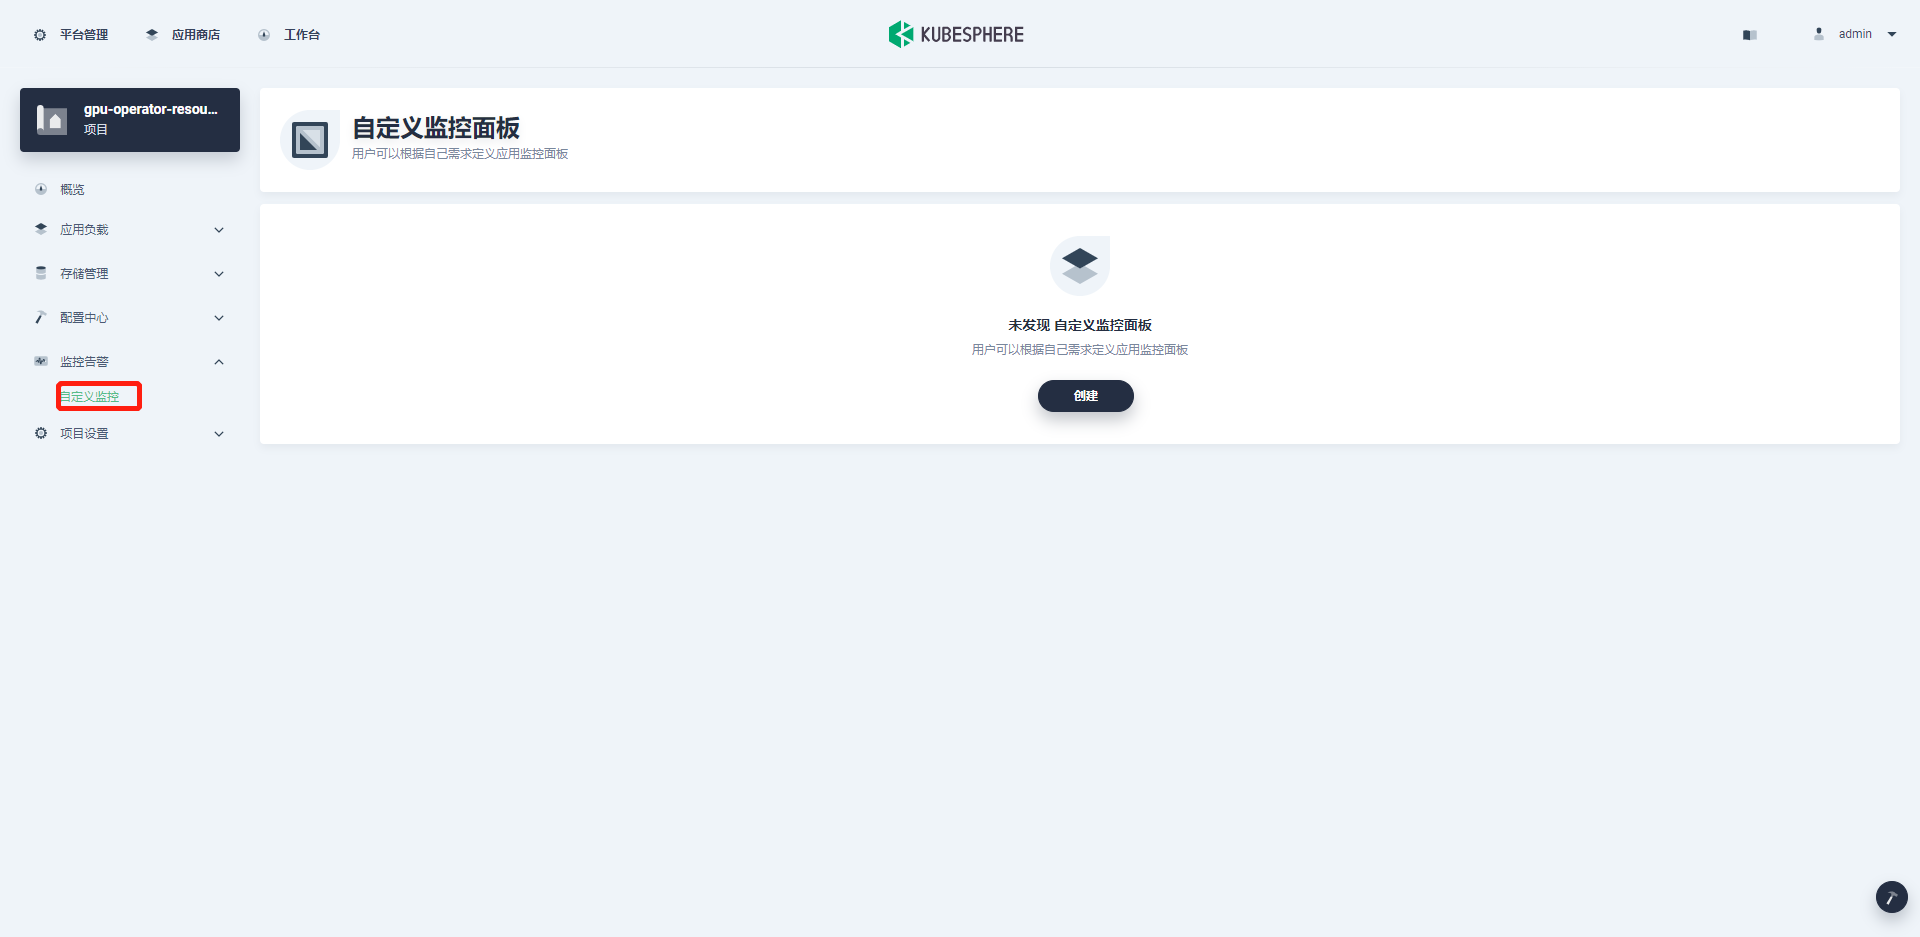
最后,进入目标企业空间,在纳管的项目找到gpu-operator-resources, 点击后找到可自定义监控界面, 即可添加自定义监控。
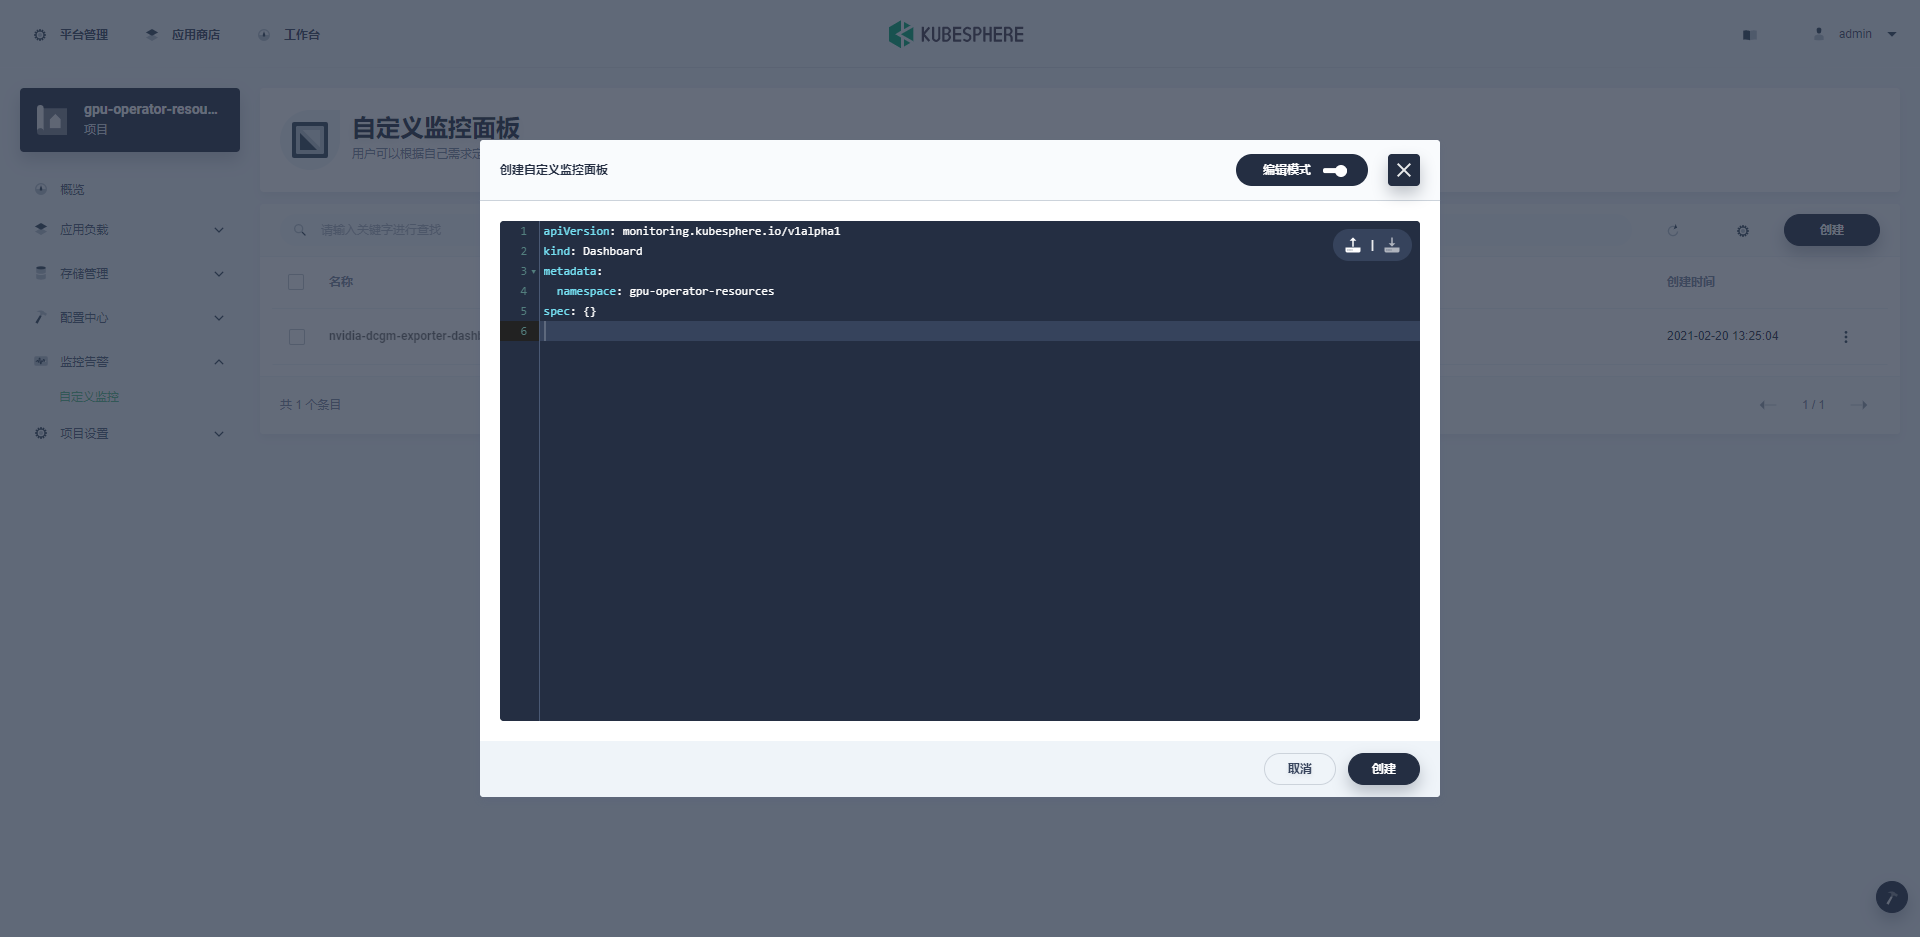
下载nvidia-gpu-dcgm-exporter-dashboard并配置namespace: $ curl -LO https://raw.githubusercontent.com/kubesphere/monitoring-dashboard/master/contrib/gallery/nvidia-gpu-dcgm-exporter-dashboard.yaml $ cat nvidia-gpu-dcgm-exporter-dashboard.yaml ---- apiVersion: monitoring.kubesphere.io/v1alpha1 kind: Dashboard metadata: name: nvidia-dcgm-exporter-dashboard-rev1 namespace: gpu-operator-resources # check here spec: -----可以直接命令行apply或者在自定义监控面板中选择编辑模式进行导入:
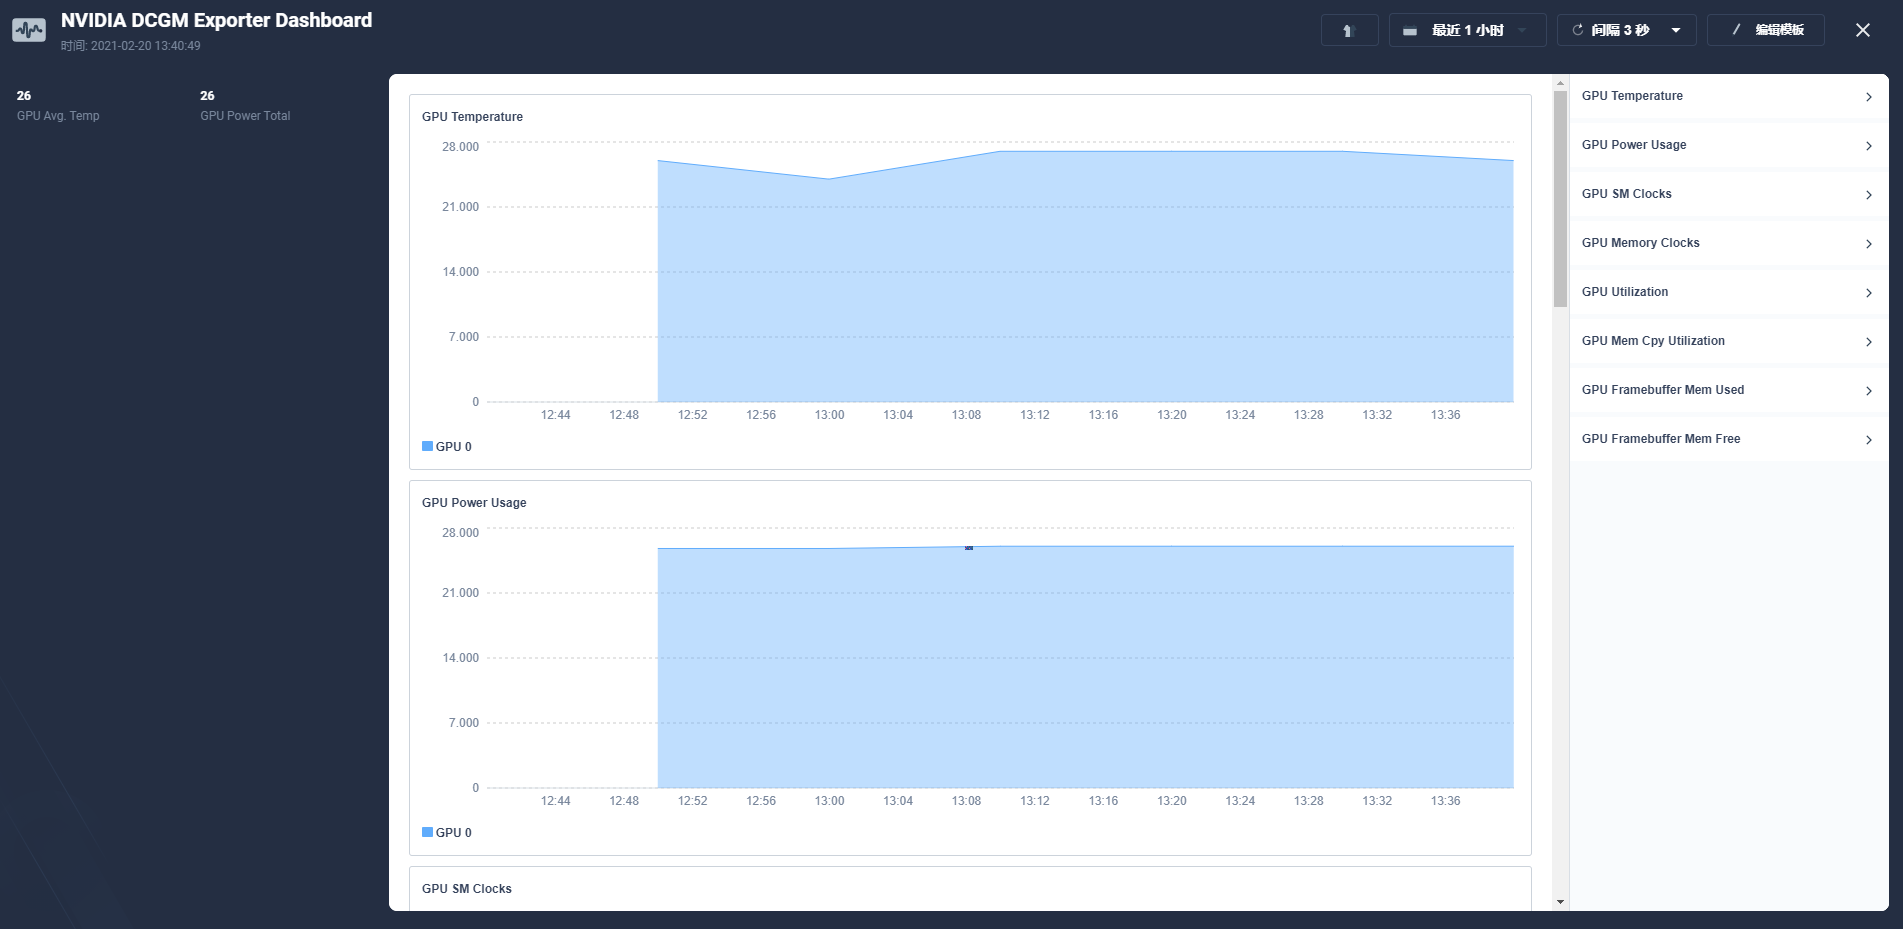
正确导入后:
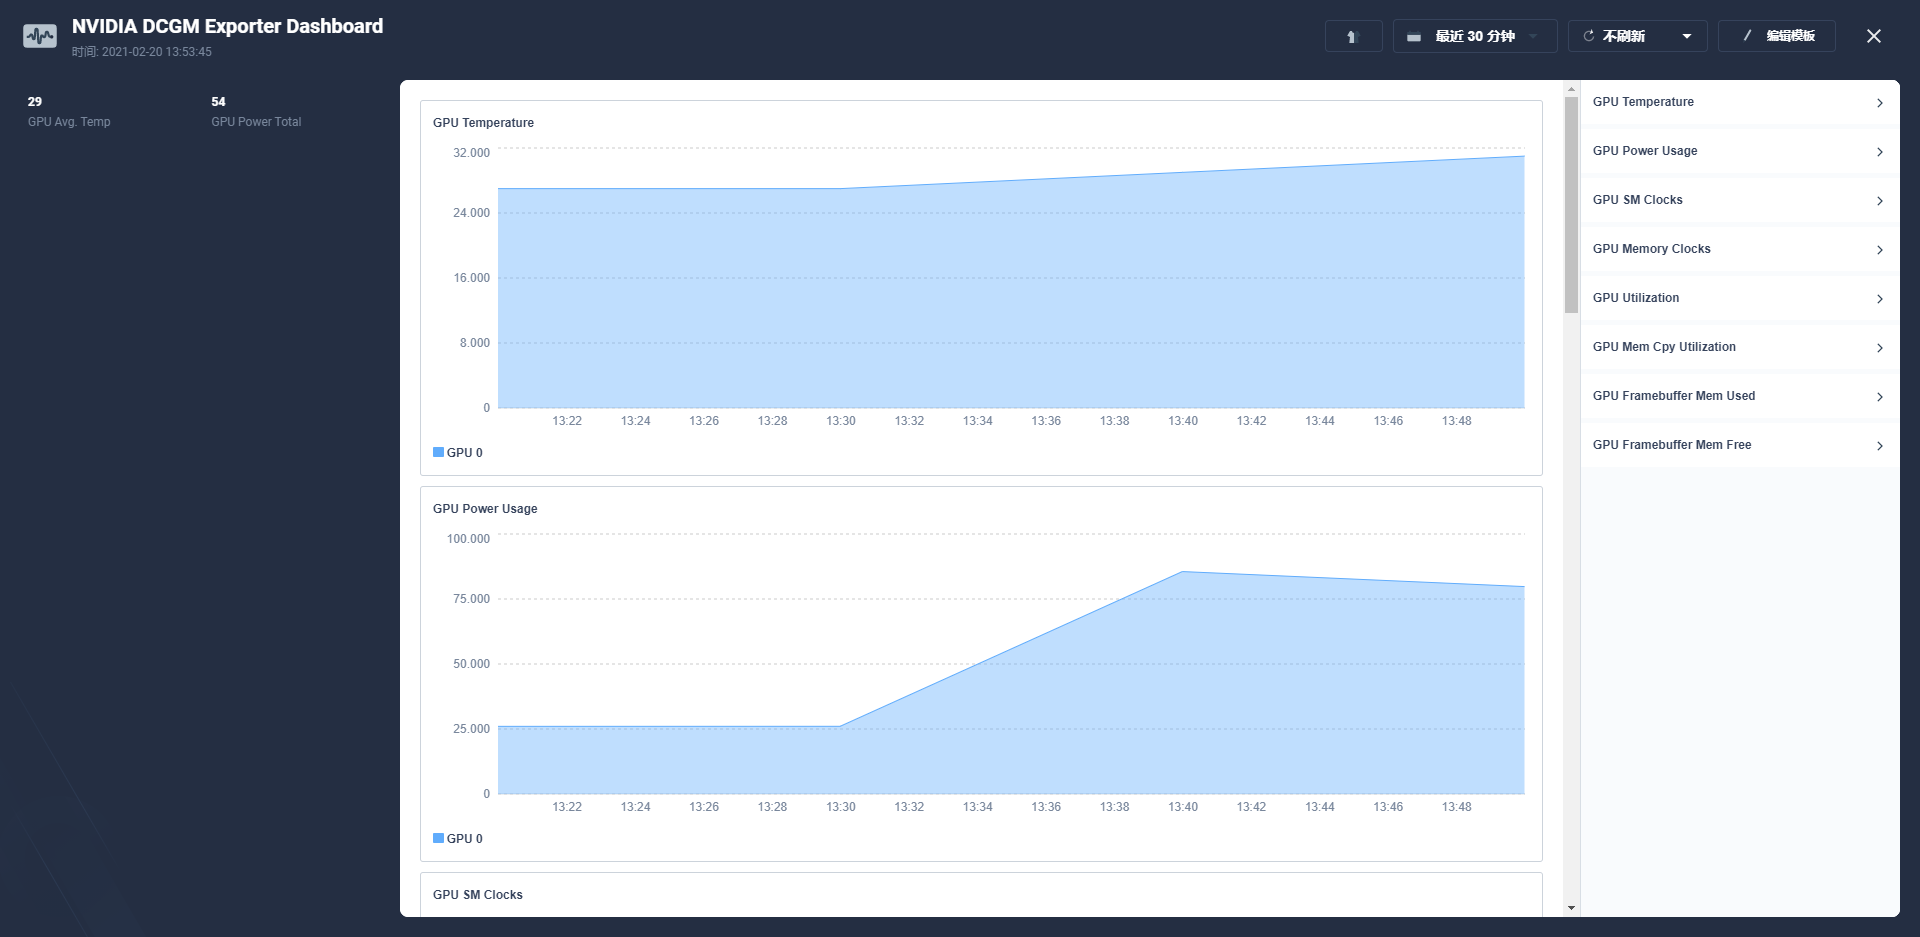
在上面创建的jupyter notebook运行深度学习测试任务后,可以明显地观察到相关GPU指标变化:
答:关于已部署正常运行的gpu-operator和 AI 应用的集群,重启 GPU 主机后会出现没法用上 GPU 的情况,极有可能是因为插件还没加载,应用优先进行了载入,就会导致这种问题。这时,只需要优先保证插件运行正常,然后重新部署应用即可。 Nvidia k8s-device-plugin 与 GPU-Operator 方案对比?我之前针对GPU使用的是 https://github.com/NVIDIA/k8s-device-plugin 和 https://github.com/NVIDIA/gpu-monitoring-tools 相结合的方案来监控 GPU,请问这个方案与 GPU-Operator的方案相比,孰优孰劣一些? 答:个人认为 GPU-Operator 更简单易用,其自带 GPU 注入能力不需要构建专用的 OS,并且支持节点发现与可插拔,能够自动化集成管理 GPU 所需的 NVIDIA 设备组件,相对来说还是很省事的。 参考资料官方代码仓库GitHub: https://github.com/NVIDIA/gpu-operator GitLab: https://gitlab.com/nvidia/kubernetes/gpu-operator 官方文档GPU-Operator 快速入门: https://docs.nvidia.com/datacenter/cloud-native/gpu-operator/getting-started.html#install-nvidia-gpu-operator GPU-Operator 离线安装指南: https://docs.nvidia.com/datacenter/cloud-native/gpu-operator/getting-started.html#considerations-to-install-in-air-gapped-clusters KubeSphere 自定义监控使用文档: https://kubesphere.com.cn/docs/project-user-guide/custom-application-monitoring/examples/monitor-mysql/# |

【本文地址】
今日新闻 |
点击排行 |
|
推荐新闻 |
图片新闻 |
|
专题文章 |