| 语义分割的评价指标 | 您所在的位置:网站首页 › 语义分割概率图 › 语义分割的评价指标 |
语义分割的评价指标
|
语义分割是像素级别的分类,其常用评价指标:
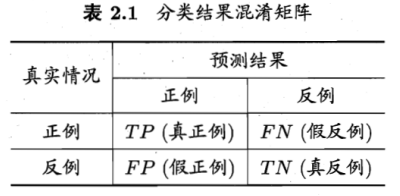
像素准确率(Pixel Accuracy,PA)、 类别像素准确率(Class Pixel Accuray,CPA)、 类别平均像素准确率(Mean Pixel Accuracy,MPA)、 交并比(Intersection over Union,IoU)、 平均交并比(Mean Intersection over Union,MIoU), 其计算都是建立在混淆矩阵(Confusion Matrix)的基础上。 1 混淆矩阵混淆矩阵就是统计分类模型的分类结果,即:统计归对类,归错类的样本的个数,然后把结果放在一个表里展示出来,这个表就是混淆矩阵 对于二分类问题,将类别A称为正例(Positive),类别B称为反例(Negative),分类器预测正确记作真(True),预测错误记作(False),由这4个基本组合,构成混淆矩阵的4个基础元素,为: TP(True Positive):真正例,模型预测为正例,实际是正例(模型预测为类别1,实际是类别1) FP(False Positive):假正例,模型预测为正例,实际是反例 (模型预测为类别1,实际是类别2) FN(False Negative):假反例,模型预测为反例,实际是正例 (模型预测为类别2,实际是类别1) TN(True Negative):真反例,模型预测为反例,实际是反例 (模型预测为类别2,实际是类别2)
这里只要记住:T开头就是表示能准确预测, 后面接的P跟N 分别表示准确地预测了猫(P) 和非猫(N) 而 F 开头表示不能准确预测,FN可以理解成猫被错误得预测成了非猫,因为N 代表的是非猫。 相反, FP 可以理解为非猫被错误地预测称了猫。 准确率(Accuracy),对应:语义分割的像素准确率 PA 公式:Accuracy = (TP + TN) / (TP + TN + FP + FN) 意义:对角线计算。预测结果中正确的占总预测值的比例(对角线元素值的和 / 总元素值的和) 精准率(Precision),对应:语义分割的类别像素准确率 CPA 公式:Precision = TP / (TP + FP) 或 TN / (TN + FN) 意义:竖着计算。预测结果中,某类别预测正确的概率 召回率(Recall),不对应语义分割常用指标 公式:Recall = TP / (TP + FN) 或 TN / (TN + FP) 意义:横着计算。真实值中,某类别被预测正确的概率 举个例子: 不管进行分类的是动物,还是图片像素点,其混淆矩阵的获取、评价指标公式的计算都是一样的! PA:像素准确率 对应:准确率(Accuracy) 含义:预测类别正确的像素数占总像素数的比例 混淆矩阵计算: 对角线元素之和 / 矩阵所有元素之和 PA = (TP + TN) / (TP + TN + FP + FN)像素精度是图像分割的最简单指标,它是正确分类的总像素除以总像素,可以理解为图像中正确分类的像素的百分比。 下面我们举一个简单的例子
道路线像素点能够地预测为道路线像素点有3 个(中间行前两个+第一行中间) ,所以TP=3 非道路线像素点能够地预测为非道路线像素点有4个(最后一整行+中间行最后一个),所以TN=4 道路线点被错误地预测为非道路线像素点有2个(第一行的左右两个角落上S),所以FN=2
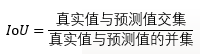
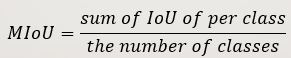
MPA:类别平均像素准确率 含义:分别计算每个类被正确分类像素数的比例,即:CPA,然后累加求平均 混淆矩阵计算: 每个类别像素准确率为:Pi(计算:对角线值 / 对应列的像素总数) MPA = sum(Pi) / 类别数 IoUIoU(intersection over union) 值得是像素的真实值与预测值的交集除以像素的真实值和预测值的并集
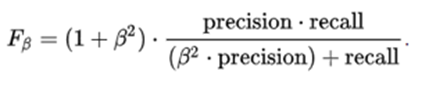
在语义分割中,MIoU 就是分别对每个类计算(真实标签和预测结果的交并比)IOU,然后再对所有类别的IOU求均值。MIoU是标准的准确率度量方法。 Dice score 是根据测试样本的准确性(precision)跟敏感度(也叫recall)计算出来的,就是平衡两个标准 precision: 用上面猫狗分类的例子解释 准确性就是 测试样本中准确地预测为猫的数除以测试样本准确预测的总数(包括猫和狗)
recall: 就是测试样本中准确地预测为猫的数除以测试样本猫总数
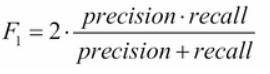
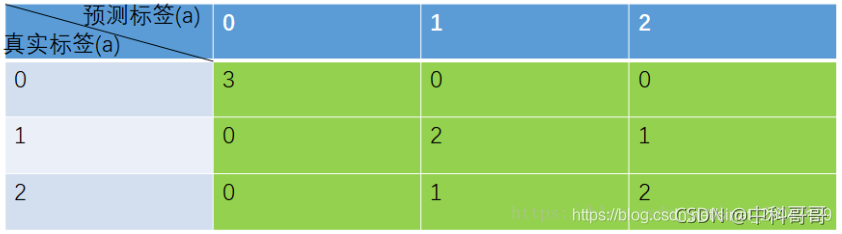
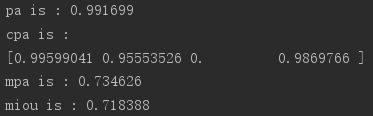
Dice score 的通用公式: 通常,我们认为recall的重要性跟precision的重要性一样,所以 belta=1 这就是所谓的 F1 score。 综合实例: PA = 对角线元素之和 / 矩阵所有元素之和 = (3 + 2 + 2) / (3 + 2 + 2 + 0 + 0 + 0 + 0 + 1 + 1)= 0.78 CPA Pi = 对角线值 / 对应列的像素总数 P类别1 = 3 / ( 3 + 0 + 0) = 1 P类别2 = 2 / ( 0 + 2 + 1) = 0.67 P类别3 = 2 / ( 0 + 1 + 2) = 0.67 MPA MPA = sum(Pi) / 类别数 = ( P类别1 + P类别2 + P类别3 ) / 3 = 0.78 IoU IoUi = 对角线值 / 与该值有关元素的求和 [画线法] 第一种求法:(混淆矩阵,以对角线值画横、竖线,将相关元素求和) IoU类别1 = 3 / (3 + 0 + 0 + 0 + 0) = 1 IoU类别2 = 2 / (0 + 2 + 1 + 0 + 1) = 0.5 IoU类别3 = 2 / (0 + 1 + 2 + 0 + 1) = 0.5 第二种求法:(代码中用的求法:SAUB = SA + SB - SA∩B)(参考链接) IoU类别1 = 3 / [(3 + 0 + 0 ) + ( 3 + 0 + 0) - 3] = 1 IoU类别2 = 2 / [(0 + 2 + 1 ) + (0 + 2 + 1) - 2] = 0.5 IoU类别3 = 2 / [(0 + 1 + 2 ) + (0 + 1 + 2) - 2] = 0.5 MIoU MIoU = sum(IoUi) / 类别数 = (1 + 0.5 + 0.5) / 3 = 0.67 """ refer to https://github.com/jfzhang95/pytorch-deeplab-xception/blob/master/utils/metrics.py """ import numpy as np __all__ = ['SegmentationMetric'] """ confusionMetric # 注意:此处横着代表预测值,竖着代表真实值,与之前介绍的相反 P\L P N P TP FP N FN TN """ class SegmentationMetric(object): def __init__(self, numClass): self.numClass = numClass self.confusionMatrix = np.zeros((self.numClass,)*2) def pixelAccuracy(self): # return all class overall pixel accuracy # PA = acc = (TP + TN) / (TP + TN + FP + TN) acc = np.diag(self.confusionMatrix).sum() / self.confusionMatrix.sum() return acc def classPixelAccuracy(self): # return each category pixel accuracy(A more accurate way to call it precision) # acc = (TP) / TP + FP classAcc = np.diag(self.confusionMatrix) / self.confusionMatrix.sum(axis=1) return classAcc # 返回的是一个列表值,如:[0.90, 0.80, 0.96],表示类别1 2 3各类别的预测准确率 def meanPixelAccuracy(self): classAcc = self.classPixelAccuracy() meanAcc = np.nanmean(classAcc) # np.nanmean 求平均值,nan表示遇到Nan类型,其值取为0 return meanAcc # 返回单个值,如:np.nanmean([0.90, 0.80, 0.96, nan, nan]) = (0.90 + 0.80 + 0.96) / 3 = 0.89 def meanIntersectionOverUnion(self): # Intersection = TP Union = TP + FP + FN # IoU = TP / (TP + FP + FN) intersection = np.diag(self.confusionMatrix) # 取对角元素的值,返回列表 union = np.sum(self.confusionMatrix, axis=1) + np.sum(self.confusionMatrix, axis=0) - np.diag(self.confusionMatrix) # axis = 1表示混淆矩阵行的值,返回列表; axis = 0表示取混淆矩阵列的值,返回列表 IoU = intersection / union # 返回列表,其值为各个类别的IoU mIoU = np.nanmean(IoU) # 求各类别IoU的平均 return mIoU def genConfusionMatrix(self, imgPredict, imgLabel): # 同FCN中score.py的fast_hist()函数 # remove classes from unlabeled pixels in gt image and predict mask = (imgLabel >= 0) & (imgLabel 0] * iu[freq > 0]).sum() return FWIoU def addBatch(self, imgPredict, imgLabel): assert imgPredict.shape == imgLabel.shape self.confusionMatrix += self.genConfusionMatrix(imgPredict, imgLabel) def reset(self): self.confusionMatrix = np.zeros((self.numClass, self.numClass)) if __name__ == '__main__': imgPredict = np.array([0, 0, 1, 1, 2, 2]) # 可直接换成预测图片 imgLabel = np.array([0, 0, 1, 1, 2, 2]) # 可直接换成标注图片 metric = SegmentationMetric(3) # 3表示有3个分类,有几个分类就填几 metric.addBatch(imgPredict, imgLabel) pa = metric.pixelAccuracy() cpa = metric.classPixelAccuracy() mpa = metric.meanPixelAccuracy() mIoU = metric.meanIntersectionOverUnion() print('pa is : %f' % pa) print('cpa is :') # 列表 print(cpa) print('mpa is : %f' % mpa) print('mIoU is : %f' % mIoU)测评截图: 步骤一:输入预测和标记图片 (4个类别分类,图片大小:512*512) imgPredict = pic_predict # 预测图片 imgLabel = pic_label # 标注图片 步骤二:获取混淆矩阵 (特别注意:此代码混淆矩阵,行为预测值,列为真实值,因此:CPA的计算需要翻转一下)
可计算上述值的和为:262144,即:图片512 * 512的值,表示模型共预测了512 * 512个像素点的类别 步骤三:评估指标计算 【语义分割】评价指标代码函数:np.sum()、np.nansum()、np.nanmean()、np.diag()、np.bincount() 参考 : https://blog.csdn.net/sinat_29047129/article/details/103656465 综合代码: """ refer to https://github.com/jfzhang95/pytorch-deeplab-xception/blob/master/utils/metrics.py """ import numpy as np import cv2 __all__ = ['SegmentationMetric'] """ confusionMetric # 注意:此处横着代表预测值,竖着代表真实值,与之前介绍的相反 P\L P N P TP FP N FN TN """ class SegmentationMetric(object): def __init__(self, numClass): self.numClass = numClass self.confusionMatrix = np.zeros((self.numClass,) * 2) # 混淆矩阵(空) def pixelAccuracy(self): # return all class overall pixel accuracy 正确的像素占总像素的比例 # PA = acc = (TP + TN) / (TP + TN + FP + TN) acc = np.diag(self.confusionMatrix).sum() / self.confusionMatrix.sum() return acc def classPixelAccuracy(self): # return each category pixel accuracy(A more accurate way to call it precision) # acc = (TP) / TP + FP classAcc = np.diag(self.confusionMatrix) / self.confusionMatrix.sum(axis=1) return classAcc # 返回的是一个列表值,如:[0.90, 0.80, 0.96],表示类别1 2 3各类别的预测准确率 def meanPixelAccuracy(self): """ Mean Pixel Accuracy(MPA,均像素精度):是PA的一种简单提升,计算每个类内被正确分类像素数的比例,之后求所有类的平均。 :return: """ classAcc = self.classPixelAccuracy() meanAcc = np.nanmean(classAcc) # np.nanmean 求平均值,nan表示遇到Nan类型,其值取为0 return meanAcc # 返回单个值,如:np.nanmean([0.90, 0.80, 0.96, nan, nan]) = (0.90 + 0.80 + 0.96) / 3 = 0.89 def IntersectionOverUnion(self): # Intersection = TP Union = TP + FP + FN # IoU = TP / (TP + FP + FN) intersection = np.diag(self.confusionMatrix) # 取对角元素的值,返回列表 union = np.sum(self.confusionMatrix, axis=1) + np.sum(self.confusionMatrix, axis=0) - np.diag( self.confusionMatrix) # axis = 1表示混淆矩阵行的值,返回列表; axis = 0表示取混淆矩阵列的值,返回列表 IoU = intersection / union # 返回列表,其值为各个类别的IoU return IoU def meanIntersectionOverUnion(self): mIoU = np.nanmean(self.IntersectionOverUnion()) # 求各类别IoU的平均 return mIoU def genConfusionMatrix(self, imgPredict, imgLabel): # """ 同FCN中score.py的fast_hist()函数,计算混淆矩阵 :param imgPredict: :param imgLabel: :return: 混淆矩阵 """ # remove classes from unlabeled pixels in gt image and predict mask = (imgLabel >= 0) & (imgLabel 0] * iu[freq > 0]).sum() return FWIoU def addBatch(self, imgPredict, imgLabel): assert imgPredict.shape == imgLabel.shape self.confusionMatrix += self.genConfusionMatrix(imgPredict, imgLabel) # 得到混淆矩阵 return self.confusionMatrix def reset(self): self.confusionMatrix = np.zeros((self.numClass, self.numClass)) # 测试内容 if __name__ == '__main__': imgPredict = cv2.imread('1.png') imgLabel = cv2.imread('2.png') imgPredict = np.array(cv2.cvtColor(imgPredict, cv2.COLOR_BGR2GRAY) / 255., dtype=np.uint8) imgLabel = np.array(cv2.cvtColor(imgLabel, cv2.COLOR_BGR2GRAY) / 255., dtype=np.uint8) # imgPredict = np.array([0, 0, 1, 1, 2, 2]) # 可直接换成预测图片 # imgLabel = np.array([0, 0, 1, 1, 2, 2]) # 可直接换成标注图片 metric = SegmentationMetric(2) # 2表示有2个分类,有几个分类就填几 hist = metric.addBatch(imgPredict, imgLabel) pa = metric.pixelAccuracy() cpa = metric.classPixelAccuracy() mpa = metric.meanPixelAccuracy() IoU = metric.IntersectionOverUnion() mIoU = metric.meanIntersectionOverUnion() print('hist is :\n', hist) print('PA is : %f' % pa) print('cPA is :', cpa) # 列表 print('mPA is : %f' % mpa) print('IoU is : ', IoU) print('mIoU is : ', mIoU)输出: hist is : [[ 43466. 11238.] [ 11238. 2582058.]] PA is : 0.991512 cPA is : [0.79456712 0.99566652] mPA is : 0.895117 IoU is : [0.65915502 0.99137043] mIoU is : 0.8252627241326803注:文中引用较多,忘记大多引用文档,如有被引用,可评论联系标明出处;共同进步! |
 假设有13种动物的样本-8只猫和5只狗
 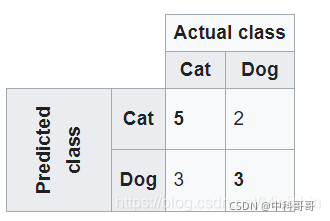 混淆矩阵中,系统预测了8只实际的猫,系统预测了3只是狗,而5只狗中,则预测有2只是猫。所有正确的预测都位于表格的对角线(以粗体突出显示)中,因此很容易从视觉上检查表格中的预测错误,因为它们将由对角线之外的值表示。
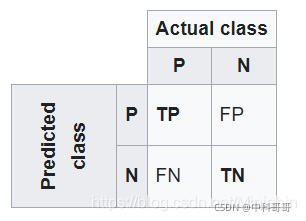 在这里我们假设猫是positive,非猫是negative (这里指的是狗)
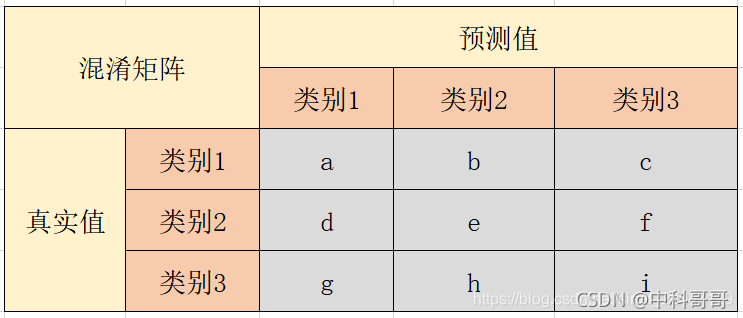 以类别1为例,计算公式为:
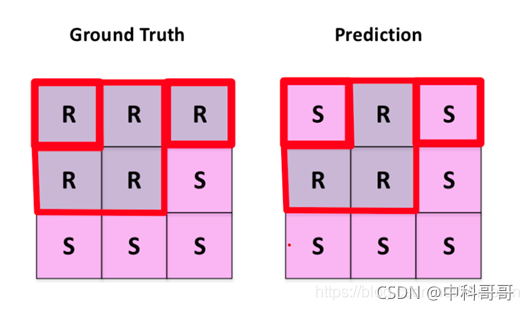 一般在图像分割,都是label图像的像素点 这里我们假设R指的是道路线像素点,S 指的是背景像素点 所以R 是positive, 非R(S)就是negative,指的是像素点不属于道路线 从上面的图我们可以看出
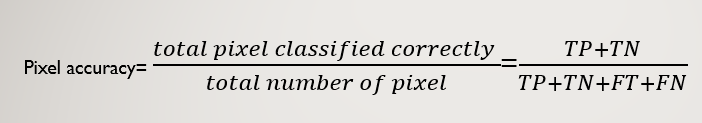 我们能够计算出像素精度:
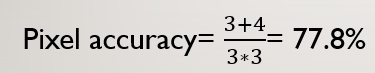
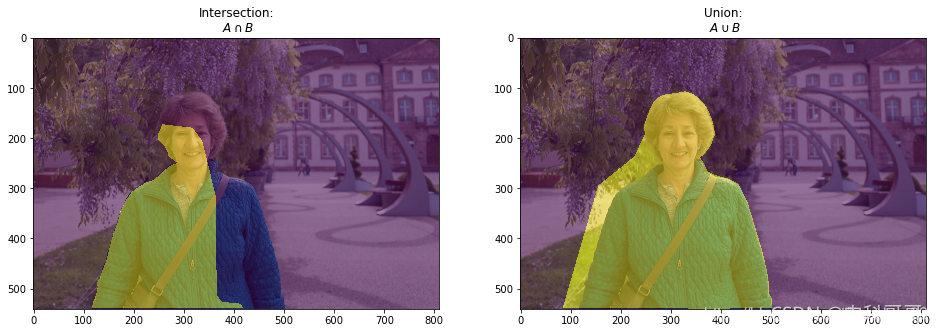
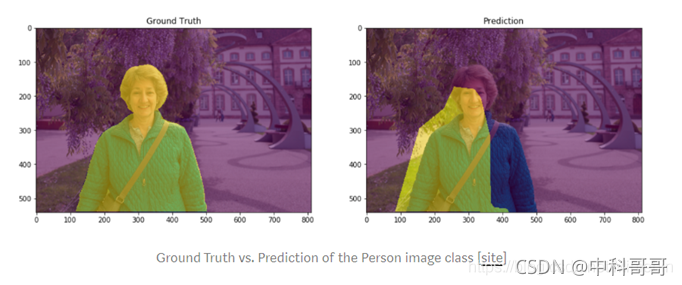 在图像分割中,我们的目标是把人物分割出来。 右边的图片是真实值(黄色部分), 左边(黄色部分)是预测值 所以我们可以计算IoU: 真实值跟预测值交集(红色部分):
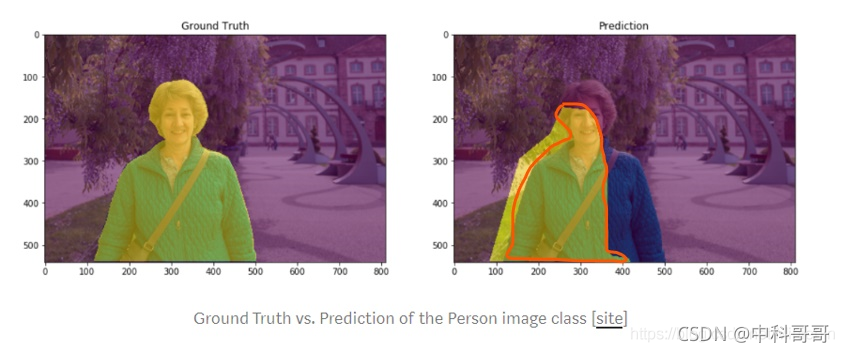 真实值与预测值的并集(红色部分):
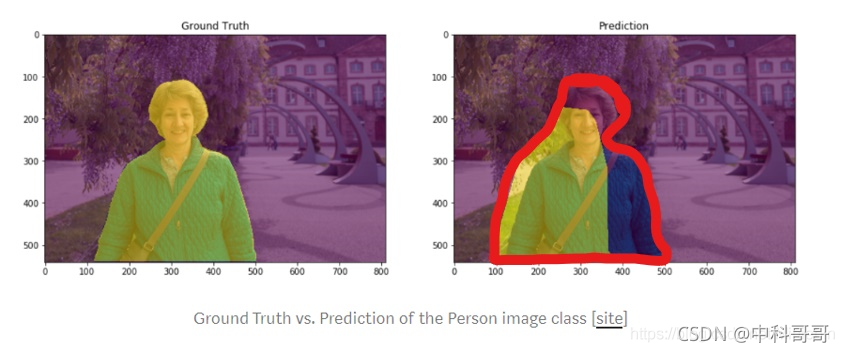
 以求二分类的MIoU为例 MIoU = (IoU正例p + IoU反例n) / 2 = [ TP / (TP + FP + FN) + TN / (TN + FN + FP) ] / 2

 PA
PA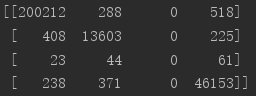
【本文地址】
| 今日新闻 |
| 推荐新闻 |
| 专题文章 |