|
1.使用plot()画基本图形
x1=linspace(1,1,10);%X1-X2 (1到1)产生10个点
y1=linspace(1,2,10);%Y1到Y2 (1到2)产生10个点
plot(x1,y1);
hold on
x2=linspace(1,2,10);%从1到2产生10个点,1.1,1.2,1.3,1.4,1.5,1.6,1.7,1.8,1.9,2
y2=linspace(2,1,10);%从2到1产生10个点,1.9,1.8,1.7,1.6,1.5,1.4,1.3,1.2,1.2,1.1
plot(x2,y2);%将各个点坐标连接成线
hold on
x3=linspace(2,2,10);
y3=linspace(1,2,10);
plot(x3,y3);
grid on;
xlim([0.5,2.5]); ylim([0.5,2.5])
plot([1 1 2 2],[1 2 1 2],'o');
 2.线与线的交点: 2.线与线的交点:
%先在同一窗口中画出两个图
x=[1,113,334,361,440,964,964,1];
y=[1,107,324,323,400,400,471,471];%数据准备
plot(x,y,'.-')%用点画线将点(x,y)连接成线
%用plot绘图是折线图,即把相邻两点之间用直线连接起来
hold on %保持当前的图与坐标轴属性,以便后续的绘图命令添加到现有的图表中
x1=[0 1000]; %数据准备
y1=x1-25;
plot(x1,y1,'r') %用红色线画出y1函数图形
%下面确定交点并标出交点
y2=471;
x2=y2+25; %确定交点(x2,y2)
[x3,y3]=solve('y=324+(323-324)/(361-334)','y=x-25');
x3=double(x3);y3=double(y3); %确定交点(x3,y3)
plot([x2, x3],[y2,y3],'mo') %以红紫色圆圈标出交点
legend('plot数据','y=x-25', '交点',2)%添加图例
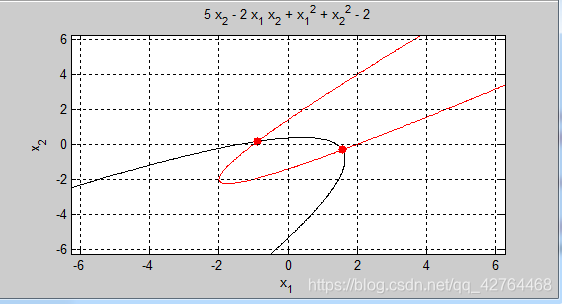
 3.在同一个图中画出下面两个曲线并标注交点: x1^2 - 2x1x2 - x1 + x2^2 - 2=0 x1^2 - 2x1x2 + x2^2 + 5*x2 - 2=0 3.在同一个图中画出下面两个曲线并标注交点: x1^2 - 2x1x2 - x1 + x2^2 - 2=0 x1^2 - 2x1x2 + x2^2 + 5*x2 - 2=0
clear all;clc;
syms x1 x2
[s1,s2]=solve('x1^2-2*x1*x2-x1+x2^2-2=0','x1^2-2*x1*x2+x2^2+5*x2-2=0');%求方程组的解
s1=double(s1);
s2=double(s2);
f1=x1^2-2*x1*x2-x1+x2^2-2;
f2=x1^2-2*x1*x2+x2^2+5*x2-2;
h1=ezplot(f1);%画f1的曲线
set(h1,'Color','r')%将f1曲线颜色设置成红色,其中h1为曲线的handle
hold on; %保持当前的图与坐标轴属性,以便后续的绘图命令添加到现有的图表中
h2=ezplot(f2);%画f2的曲线
set(h2,'Color','k')%将f2曲线颜色设置成黑色,其中h2为曲线的handle
grid on
plot(s1,s2,'r.','MarkerSize',20)%用红色的点标记交点,标记点大小为20
 4.求下图双曲线方程x2/42-y2/32=1和直线方程y=1/2*x+1的交点: 4.求下图双曲线方程x2/42-y2/32=1和直线方程y=1/2*x+1的交点:
close all; clear all; clc
syms x y %定义变量x,y
s=solve(x^2/4^2-y^2/3^2==1,y==1/2*x+1,x,y);%求双曲子与直线的交点
X=double(s.x);
Y=double(s.y);
h1=ezplot(x^2/4^2-y^2/3^2==1,[-10,10]);
set(h1,'color','r','LineWidth',2)%设置线的颜色为红色
axis equal;
hold on;
h2=ezplot(y==1/2*x+1,[-10,10]);
set(h2,'color','k','LineWidth',2)
legend('x^2/4^2-y^2/3^2=1','y=1/2*x+1',2)%在左上角加入图例
plot(X,Y,'r.','MarkerSize',20)%用红色的实心点标注交点
text(X(1),Y(1),'(7.4788, 4.7394)','FontSize',12)%在交点处标注交点
text(X(2),Y(2),'(-4.2788, -1.1394)','fontsize',12)
plot(0,[-15:0.01:15],'k');%画出y轴
plot([-15:0.01:15],0,'k');%画出x轴
 5.抛物线方程y^2=4x和直线方程y=2x-1的交点。 5.抛物线方程y^2=4x和直线方程y=2x-1的交点。
close all; clear all; clc
syms x y
s=solve(y^2==4*x,y==2*x-1,x,y);
X=double(s.x);
Y=double(s.y);
h1=ezplot(y^2==4*x);
set(h1,'color',[0,0,0],'LineWidth',2)
axis equal;
hold on;
h2=ezplot(y==2*x-1);
set(h2,'color',[0,0,1],'LineWidth',2)
legend('y^2=4*x','y=2*x-1',2)
plot(X,Y,'r.','MarkerSize',20)
text(X(1),Y(1),'(1.8660,2.7321)','FontSize',12)
text(X(2),Y(2),'(0.1340,-0.7321)','fontsize',12)
plot(0,[-10:0.01:10],'k');
plot([-10:0.01:10],0,'k')
 6.椭圆方程x2/52+y2/42=1和双曲线方程x2/42-y2/32=1的交点。 6.椭圆方程x2/52+y2/42=1和双曲线方程x2/42-y2/32=1的交点。
close all; clear all; clc
syms x y
s=solve(x^2/5^2+y^2/4^2==1,x^2/4^2-y^2/3^2==1,x,y);
X=double(s.x);
Y=double(s.y);
h1=ezplot(x^2/5^2+y^2/4^2==1);
set(h1,'color',[0,0,0],'LineWidth',2)
axis equal; hold on;
h2=ezplot(x^2/4^2-y^2/3^2==1);
set(h2,'color',[0,0,0],'LineWidth',2)
plot(X,Y,'r.','MarkerSize',20)
text(X(1),Y(1),'(4.5596, 1.6415)','FontSize',11)
text(X(2),Y(2),'(-4.5596, 1.6415)','fontsize',11)
text(X(3),Y(3),'(4.5596, -1.6415)','FontSize',11)
text(X(4),Y(4),'(-4.5596, -1.6415)','fontsize',11)
plot(0,[-10:0.01:10],'k');plot([-10:0.01:10],0,'k')
 7.求两个双曲线的交点 7.求两个双曲线的交点
close all; clear all; clc
syms x y
s=solve(x^2-y^2/15==1,(x-8)^2/4-y^2/12==1);
X=double(s.x);
Y=double(s.y);
h1=ezplot(x^2-y^2/15==1,[-100,100,-100,100]);
set(h1,'color','b','LineWidth',2)
axis equal; hold on;
h2=ezplot((x-8)^2/4-y^2/12==1,[-100,100,-100,100]);
set(h2,'color','k','LineWidth',2)
plot(X,Y,'g.','MarkerSize',20)
text(X(1),Y(1),'(2.5,(3*35^(1/2))/2)','FontSize',11)
text(X(2),Y(2),'(2.5, -(3*35^(1/2))/2)','fontsize',11)
text(X(3),Y(3),'(6.5, (15*11^(1/2))/2)','FontSize',11)
text(X(4),Y(4),'(-6.5, (15*11^(1/2))/2)','fontsize',11)
 9.双曲线定位问题: 9.双曲线定位问题:
close all; clear all; clc
syms x y
f1 = sqrt(x^2+(y-0.35/1.414)^2)-sqrt((x-0.15/1.414)^2+(y-0.20/1.414)^2)-(2.5000e-04)*340;
f2 = sqrt((x-0.05/1.414)^2+(y-0.15/1.414)^2)-sqrt((x-0.30/1.414)^2+(y-0.05/1.414)^2)-(1.25000e-04)*340;
s = solve(f1,f2);
X = double(s.x);
Y = double(s.y);
h1=ezplot('abs(sqrt(x^2+(y-0.35/1.414)^2)-sqrt((x-0.15/1.414)^2+(y-0.20/1.414)^2))-(2.5000e-04)*340',[-0.8,0.8,-0.8,4])
set(h1,'color','b','LineWidth',2)
hold on;
h2=ezplot('abs(sqrt((x-0.05/1.414)^2+(y-0.15/1.414)^2)-sqrt((x-0.30/1.414)^2+(y-0.05/1.414)^2))-(1.25000e-04)*340',[-0.8,0.8,-0.8,4])
set(h2,'color','r','LineWidth',2)
legend('f1','f2',2)
plot(X,Y,'g.','MarkerSize',20)
text(X(1),Y(1),'A','FontSize',11)
text(X(2),Y(2),'B','fontsize',11)
text(X(3),Y(3),'C','FontSize',11)
text(X(4),Y(4),'D','fontsize',11)

|