| 如何将全国各省份人口数据绘制成地域分布图?Python 轻松解决 | 您所在的位置:网站首页 › 如何用数据生成地图分布图片 › 如何将全国各省份人口数据绘制成地域分布图?Python 轻松解决 |
如何将全国各省份人口数据绘制成地域分布图?Python 轻松解决
|
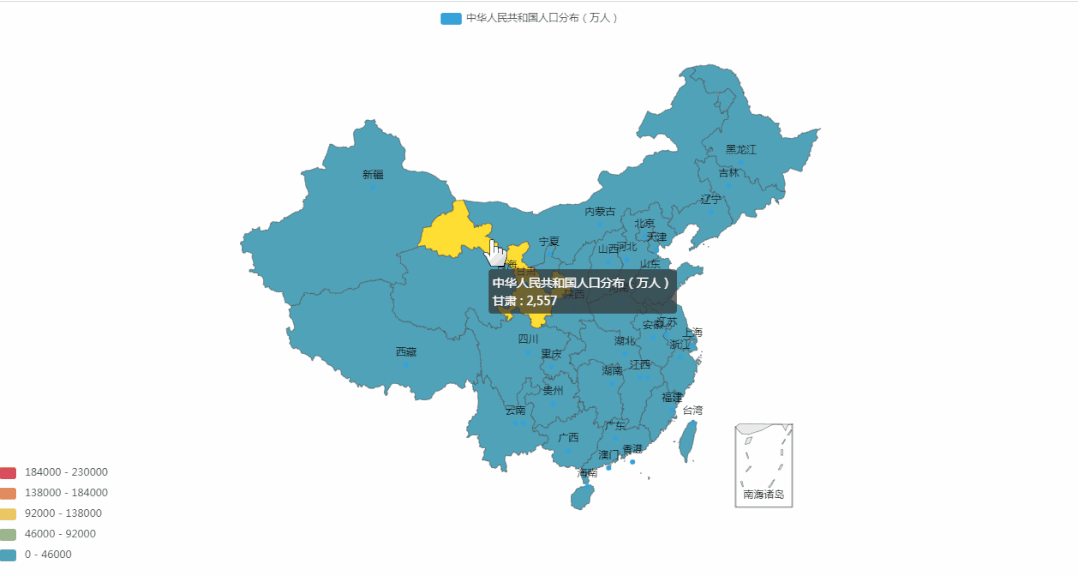
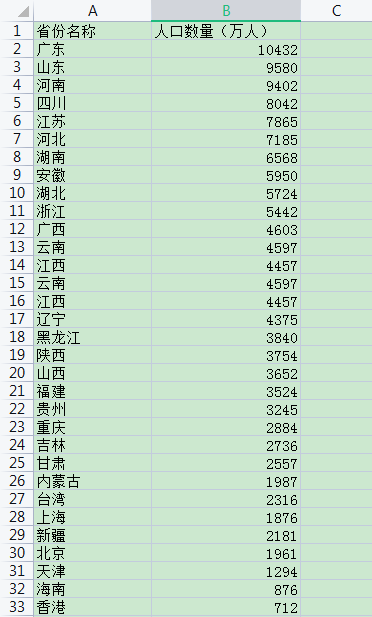
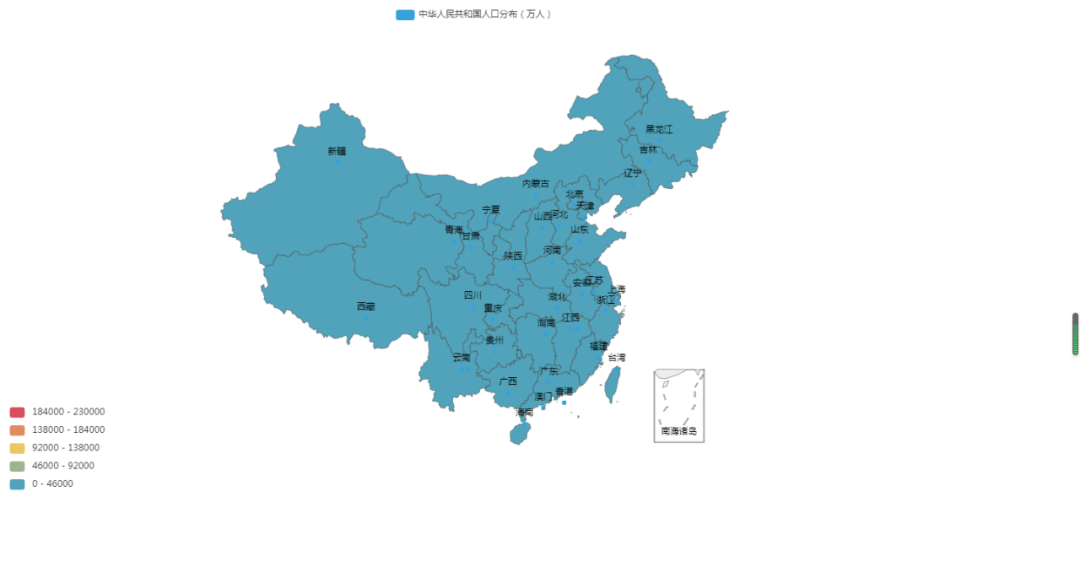
今天收到一个可视化数据分析的小需求,客户提供了一份各省份人口的Excel的数据文档。需要将Excel中的数据提取出来,最后将数据展示到一个平面的中国地图上面形成一个可视化的人口分布展示效果。 先展示一下已经生成的中华人民共和国人口分布图的效果吧! 这次可以选用 pyecharts 这个框架来实现,这个框架是基于前端的echarts框架实现的,使用起来相对比较简单。 下面是Excel文档中存储的人口分布数据,数据不具备当前中国人口的真实性。
使用pandas的read_excel函数读取excel文档数据。 # Importing the pandas library and giving it the alias pd. import pandas as pd # Importing the numpy library and giving it the alias np. import numpy as np # A module that allows you to print things in a pretty way. from pprint import pprint # Reading the excel file and storing it in a dataframe. person_data_frame = pd.read_excel('./person_data.xlsx') # Converting the dataframe into a list. person_data_list = np.array(person_data_frame).tolist() # Printing the list of lists. pprint(person_data_list)这是从Excel数据文档中读取的地域人口的数据,将其转换成数组后使用pprint打印出list数据列表。 [['广东', 10432], ['山东', 9580], ['河南', 9402], ['四川', 8042], ['江苏', 7865], ['河北', 7185], ['湖南', 6568], ['安徽', 5950], ['湖北', 5724], ['浙江', 5442], ['广西', 4603], ['云南', 4597], ['江西', 4457], ['云南', 4597], ['江西', 4457], ['辽宁', 4375], ['黑龙江', 3840], ['陕西', 3754], ['山西', 3652], ['福建', 3524], ['贵州', 3245], ['重庆', 2884], ['吉林', 2736], ['甘肃', 2557], ['内蒙古', 1987], ['台湾', 2316], ['上海', 1876], ['新疆', 2181], ['北京', 1961], ['天津', 1294], ['海南', 876], ['香港', 712], ['宁夏', 654], ['青海', 578], ['西藏', 315], ['澳门', 56]]然后,将pycharts的非标准模块导入进来,并且配置相应的地图参数。 # Importing all the charts from the pyecharts library. from pyecharts.charts import * # Importing the options module from the pyecharts library and giving it the alias opts. from pyecharts import options as opts调用pyecharts模块中的Map对象,使用opts.InitOpts函数初始化主题颜色、宽度、高度的大小。 map = Map(init_opts=opts.InitOpts(theme='light', width='1250px', height='650px'))设置地图的范围属性为china,就是显示的整个中国地图,若是某个区域则可以按具体区域名称进行设置。 紧接着设置data_pair的数据来源为我们前面从Excel数据文档中读取到的list列表数据,随后设置地图显示的标题即可。 map.add('中华人民共和国人口分布(万人)', data_pair=person_data_list, maptype='china') map.set_global_opts(visualmap_opts=opts.VisualMapOpts( max_=230000, is_piecewise=True ))最后使用Map的函数render生成显示的html源文件-render.html。 # Creating a html file called render.html. map.render()在任意浏览器中打开已经生成好的render.html文件就能形成一个动态显示的中国地图。
|

【本文地址】
公司简介
联系我们