| transPlotR 优雅的绘制基因转录本结构 | 您所在的位置:网站首页 › 基因结构作图技巧 › transPlotR 优雅的绘制基因转录本结构 |
transPlotR 优雅的绘制基因转录本结构
|
无能为力
这个工作大概陆陆续续花费了一周多的时间基本完善的差不多了。你会想不会有这么多轮子了吗?(R 包),比如 ggtranscript, gggenes, wiggleplotr, Gviz 等等, 有些包用起来太复杂,有些又或者达不到自己的可视化要求,功能太少等等的不足或者限制,说白了也许就是自己屁事多, 我觉得比较好看的是 IGV 里面的转录本结构比较漂亮,也符合生物学意义。 有时候需要逼自己造个轮子出来方便自己使用,于是写了这个 transPlotR package, 非常简单,就只有一个函数,前前后后也增加了很多功能,硬扣细节,最终搞了个差不多的样子出来。也分享给大家使用。 2介绍只有一个函数 trancriptVis 来可视化基因结构,需要输入你的 GTF 文件就行了(你可以使用 rtracklayer 进行读取),操作方便简洁。 主要功能: 绘制编码或者非编码基因的转录本结构。 支持多个基因。 折叠多个转录本。 支持跨距离,跨染色体基因可视化。 极坐标展示基因结构。 添加新 style 的箭头表示转录方向。 绘制相对距离的位置坐标(以转录起始位置/终止位置为起点)。 反转负链基因的结构位置。 ... 觉得有用的小伙伴欢迎在我的 github 上面留下你们的小星星哦! 3安装 # install.packages("devtools") devtools::install_github("junjunlab/transPlotR")github 地址: https://github.com/junjunlab/transPlotR 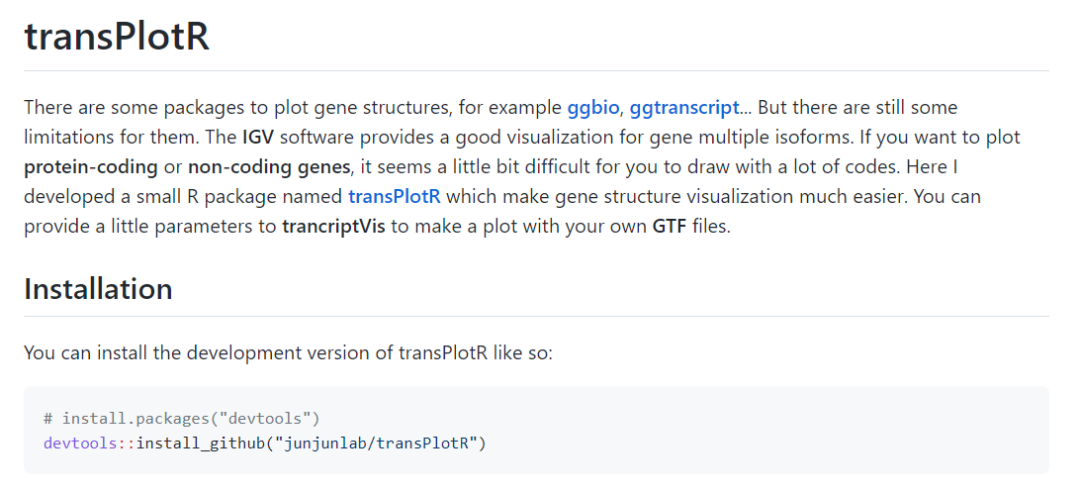
参考手册链接: https://github.com/junjunlab/transPlotR/wiki/TransPlot-documentation 4单个基因绘制非编码基因: # load test data data(gtf) # non-coding gene trancriptVis(gtfFile = gtf, gene = 'Xist')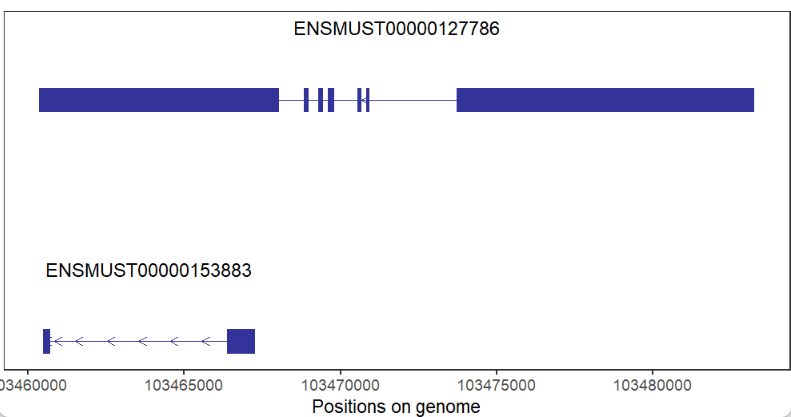
编码基因: 粗的代表 CDS 区域,较粗的为 UTR,细线为内含子,箭头方向为基因转录方向。 # coding gene trancriptVis(gtfFile = gtf, gene = 'Nanog')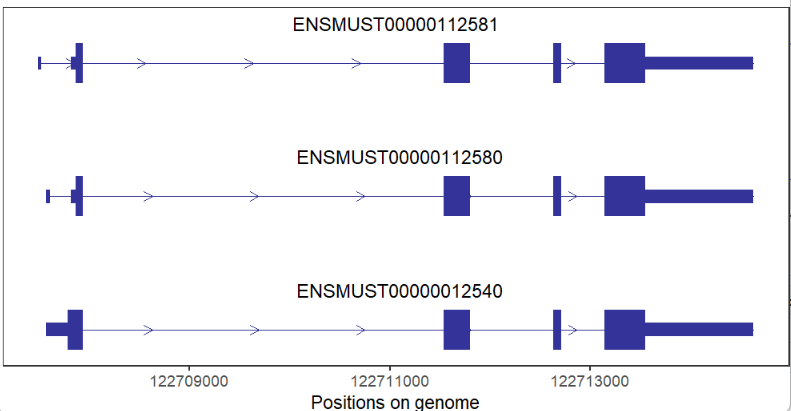
修改填充颜色: # change fill color trancriptVis(gtfFile = gtf, gene = 'Nanog', exonFill = '#CCFF00')
修改标签大小,颜色及位置: # change label size,color and position trancriptVis(gtfFile = gtf, gene = 'Nanog', textLabelSize = 4, textLabelColor = 'red', relTextDist = 0)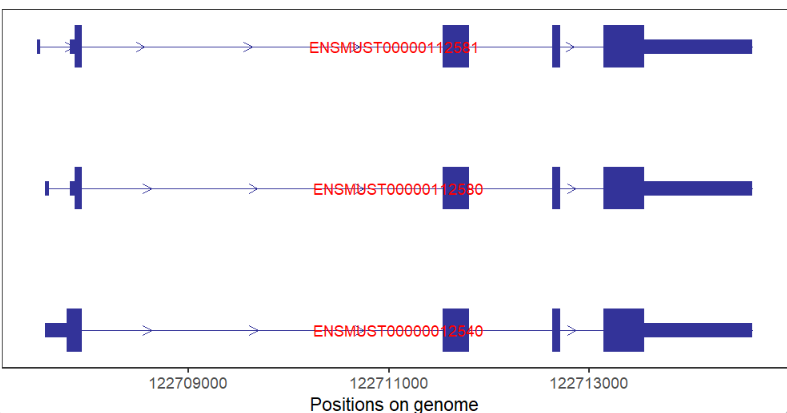
标注基因名: # aes by gene name trancriptVis(gtfFile = gtf, gene = 'Nanog', textLabel = 'gene_name')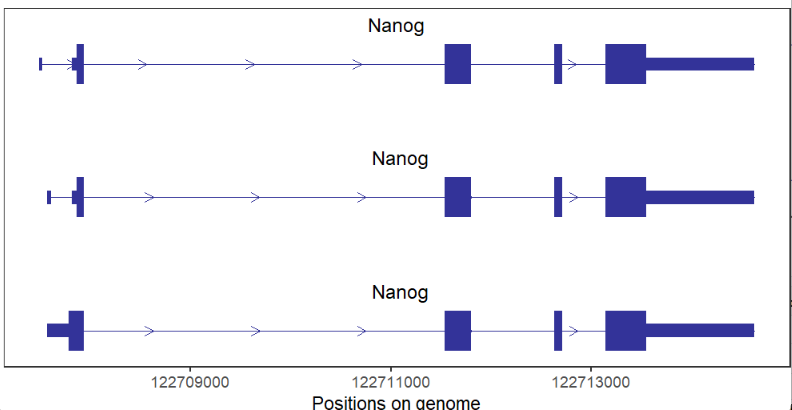
用转录本映射颜色: # color aes by transcript trancriptVis(gtfFile = gtf, gene = 'Tpx2', exonColorBy = 'transcript_id')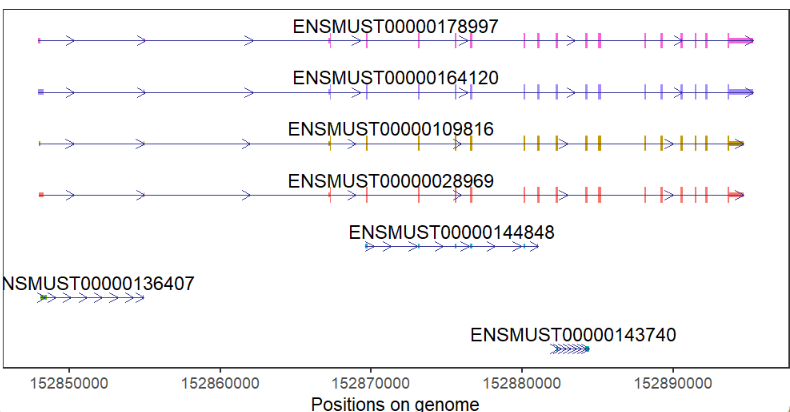
修改箭头颜色及类型: # change arrow color and type trancriptVis(gtfFile = gtf, gene = 'Nanog', arrowCol = 'orange', arrowType = 'closed')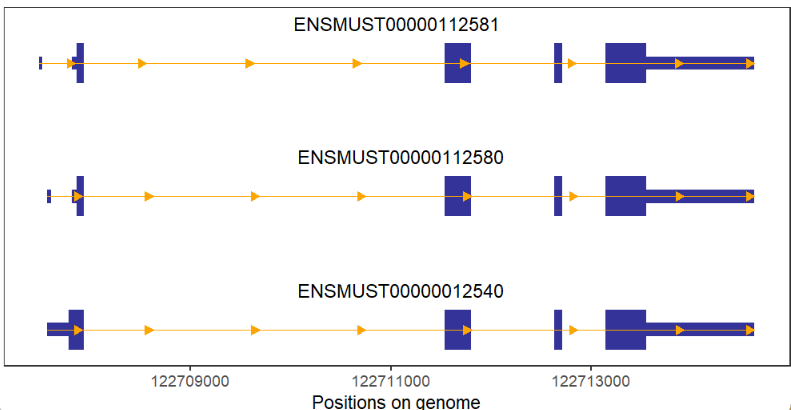
如果没有内含子,可以改变箭头颜色,更加容易分辨: # no intron gene and add arrow color # change arrow color and type trancriptVis(gtfFile = gtf, gene = 'Jun', textLabel = 'gene_name', arrowCol = 'white', arrowType = 'closed') + theme_void()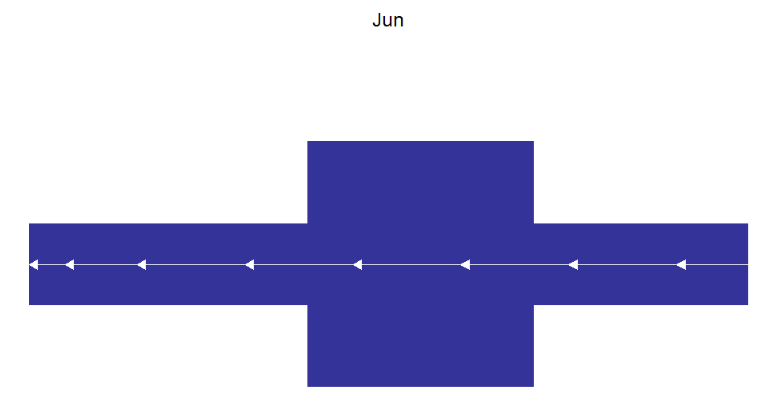
添加箭头数量: # add arrow breaks trancriptVis(gtfFile = gtf, gene = 'Nanog', arrowCol = 'orange', arrowType = 'closed', arrowBreak = 0.1)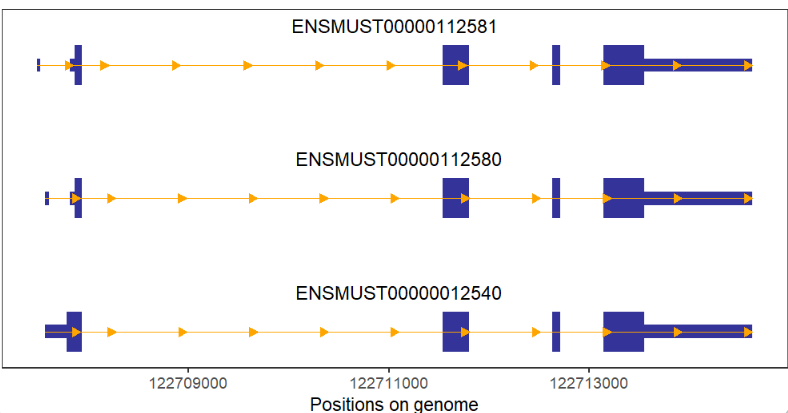
指定特定的转录本进行可视化: # draw specific transcript p1 |

【本文地址】