| Opencv+Python实现缺陷检测 | 您所在的位置:网站首页 › 图片破损 › Opencv+Python实现缺陷检测 |
Opencv+Python实现缺陷检测
|
实验七、缺陷检测
一、 题目描述
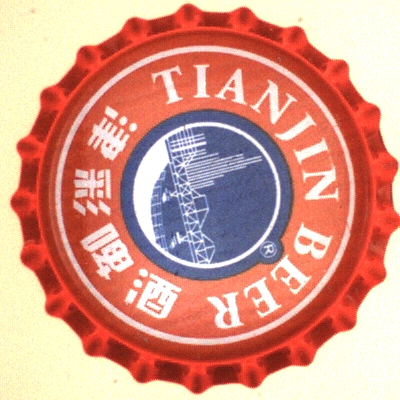
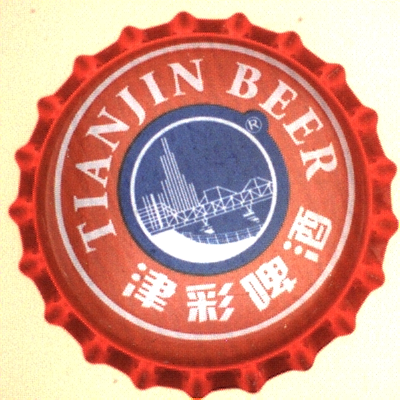
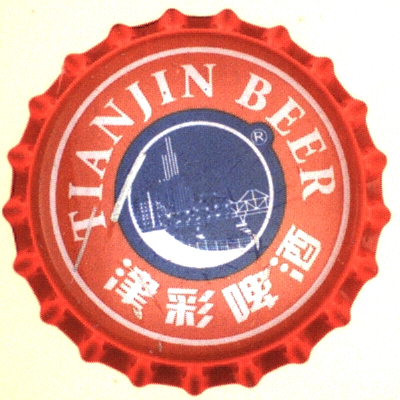
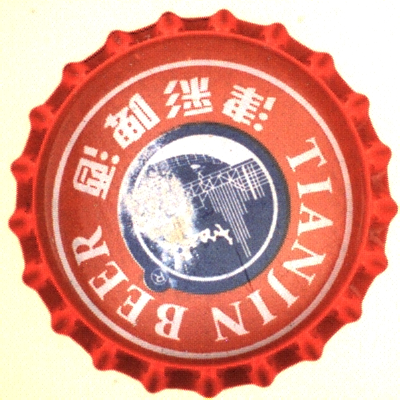
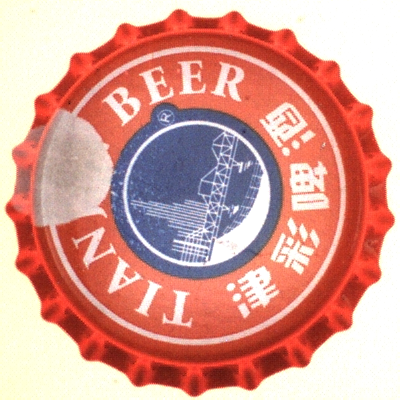
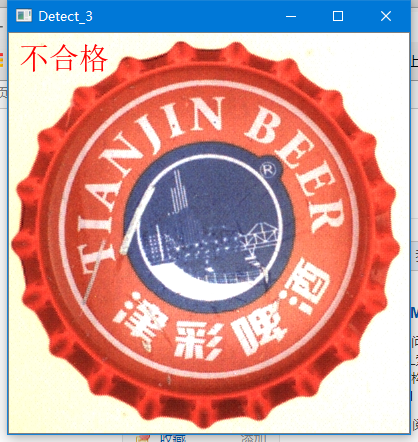
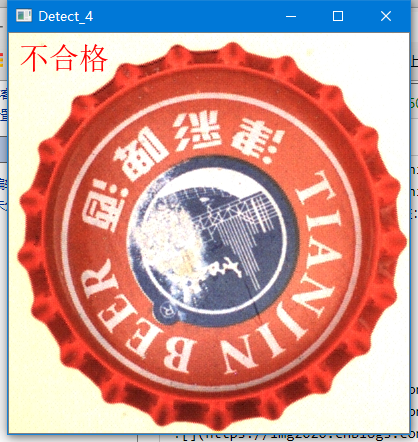
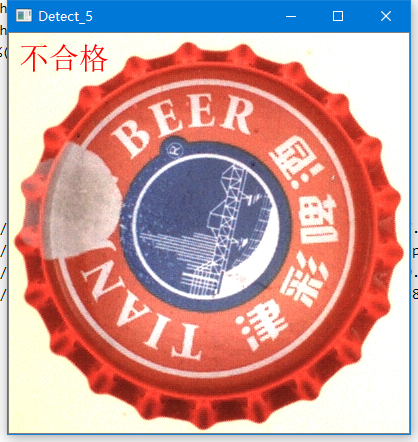
对下面的图片进行缺陷检测操作,请详细地记录每一步操作的步骤。 第一站图片是标准样品,后面几张图中有几个样品有瑕疵,需要你通过计算在图片上显示出哪张是合格,哪张不合格。 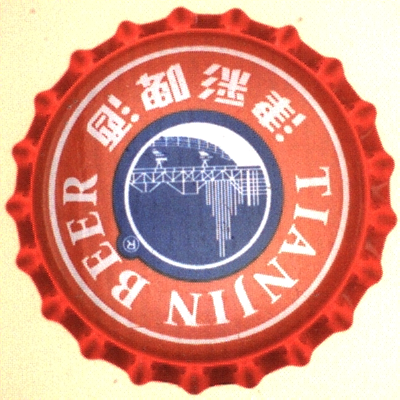
 **1.思路** **1.思路**
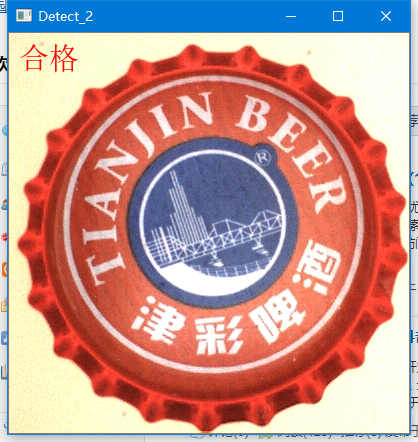
Python-Opencv中用compareHist函数进行直方图比较进而对比图片 图像直方图 图像直方图是反映一个图像像素分布的统计表,其实横坐标代表了图像像素的种类,可以是灰度的,也可以是彩色的。纵坐标代表了每一种颜色值在图像中的像素总数或者占所有像素个数的百分比。 图像是由像素构成,因为反映像素分布的直方图往往可以作为图像一个很重要的特征。在实际工程中,图像直方图在特征提取、图像匹配等方面都有很好的应用。 直方图比较 1.图像相似度比较 如果我们有两张图像,并且这两张图像的直方图一样,或者有极高的相似度,那么在一定程度上,我们可以认为这两幅图是一样的,这就是直方图比较的应用之一。 2.分析图像之间关系 两张图像的直方图反映了该图像像素的分布情况,可以利用图像的直方图,来分析两张图像的关系。 直方图比较函数 cv2.compareHist(H1, H2, method) 其中: H1,H2 分别为要比较图像的直方图 method - 比较方式 比较方式(method) 相关性比较 (method=cv.HISTCMP_CORREL) 值越大,相关度越高,最大值为1,最小值为0卡方比较(method=cv.HISTCMP_CHISQR 值越小,相关度越高,最大值无上界,最小值0巴氏距离比较(method=cv.HISTCMP_BHATTACHARYYA) 值越小,相关度越高,最大值为1,最小值为0 二、 实现过程 1.给图片添加文字的函数 #用于给图片添加中文字符 def ImgText_CN(img, text, left, top, textColor=(0, 255, 0), textSize=20): if (isinstance(img, np.ndarray)): #判断是否为OpenCV图片类型 img = Image.fromarray(cv2.cvtColor(img, cv2.COLOR_BGR2RGB)) draw = ImageDraw.Draw(img) fontText = ImageFont.truetype(r'C:\Windows\Fonts\simsun.ttc', textSize, encoding="utf-8") draw.text((left, top), text, textColor, font=fontText) return cv2.cvtColor(np.asarray(img), cv2.COLOR_RGB2BGR) 2.比较相关性并绘制文字 def compare(result,img0,i): if result >0.9: detect=ImgText_CN(img0, '合格', 10, 10, textColor=(255, 0, 0), textSize=30) else: detect=ImgText_CN(img0, '不合格', 10, 10, textColor=(255, 0, 0), textSize=30) cv2.imshow("Detect_%d"%(i),detect) key = cv2.waitKey(0) if key==27: #按esc键时,关闭所有窗口 print(key) cv2.destroyAllWindows() 3.创建灰度直方图 def create_hist(img): img = cv2.imread(img) #读取图片 img_gray = cv2.cvtColor(img, cv2.COLOR_BGR2GRAY) #将图片转化为8bit灰度图 plt.imshow(img_gray, cmap=plt.cm.gray) #显示图片 hist = cv2.calcHist([img], [0], None, [256], [0, 256]) #灰度直方图 plt.figure() plt.title("Grayscale Histogram") plt.xlabel("Bins") plt.ylabel("# of Pixels") plt.plot(hist) plt.xlim([0, 256]) plt.show() return hist 4.完整代码 %matplotlib inline from matplotlib import pyplot as plt import cv2 import numpy as np from PIL import Image, ImageDraw, ImageFont #用于给图片添加中文字符 def ImgText_CN(img, text, left, top, textColor=(0, 255, 0), textSize=20): if (isinstance(img, np.ndarray)): #判断是否为OpenCV图片类型 img = Image.fromarray(cv2.cvtColor(img, cv2.COLOR_BGR2RGB)) draw = ImageDraw.Draw(img) fontText = ImageFont.truetype(r'C:\Windows\Fonts\simsun.ttc', textSize, encoding="utf-8") ##中文字体 draw.text((left, top), text, textColor, font=fontText) #写文字 return cv2.cvtColor(np.asarray(img), cv2.COLOR_RGB2BGR) def compare(result,img0,i): if result >0.9: #相关性大于0.9为合格,反之为不合格 detect=ImgText_CN(img0, '合格', 10, 10, textColor=(255, 0, 0), textSize=30) else: detect=ImgText_CN(img0, '不合格', 10, 10, textColor=(255, 0, 0), textSize=30) cv2.imshow("Detect_%d"%(i),detect) #显示绘制后的图片 key = cv2.waitKey(0) if key==27: #按esc键时,关闭所有窗口 print(key) cv2.destroyAllWindows() def create_hist(img): img = cv2.imread(img) #读取图片 img_gray = cv2.cvtColor(img, cv2.COLOR_BGR2GRAY) #将图片转化为8bit灰度图 plt.imshow(img_gray, cmap=plt.cm.gray) #显示图片 hist = cv2.calcHist([img], [0], None, [256], [0, 256]) #灰度直方图 plt.figure() plt.title("Grayscale Histogram") plt.xlabel("Bins") plt.ylabel("# of Pixels") plt.plot(hist) plt.xlim([0, 256]) plt.show() return hist hist1=create_hist("0.png") #给标准样品绘制直方图 for i in range(1,6): print(i) #打印图片序号 img=cv2.imread("%d.bmp"%(i),1) hist2=create_hist("%d.bmp"%(i)) #给测试样品绘制直方图 match1 = cv2.compareHist(hist1, hist2, cv2.HISTCMP_BHATTACHARYYA) #返回巴氏距离 match2 = cv2.compareHist(hist1, hist2, cv2.HISTCMP_CORREL) #返回相关性 print("巴氏距离:%s, 相关性:%s" %(match1, match2)) print("\n") compare(match2,img,i) #比较并绘制 三、 运行结果(效果)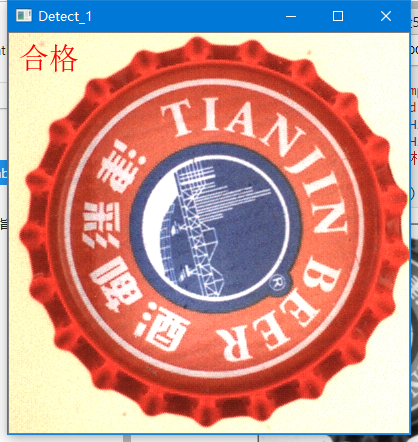
四、 问题及解决方法
中文无法输入,解决方案:引入中文字体
五、 实验总结
四、 问题及解决方法
中文无法输入,解决方案:引入中文字体
五、 实验总结
通过查阅资料,学习了OpenCV的缺陷检测技术,提升了自己的能力。 实验参考:https://blog.csdn.net/qq_44262417/article/details/89217011 |
【本文地址】
公司简介
联系我们
| 今日新闻 |
| 推荐新闻 |
| 专题文章 |