|
文章目录
1 数据来源2 数据可视化2.1 数量可视化1. 男性运动员年龄分布直方图2. 女性运动员年龄分布直方图3. 全体运动员年龄分布直方图4. 男性运动员身高体重分布散点图5. 女性运动员身高体重分布散点图6. 全体运动员身高体重分布散点图
2.2 地理可视化1. 历届奥运会各国运动员分布轮播地图2. 历届夏奥会各国运动员分布轮播地图3. 历届冬奥会各国运动员分布轮播地图4. 历届夏奥会主办城市地图5. 历届冬奥会主办城市地图6. 历届夏奥会主办城市轨迹地图7. 历届冬奥会主办城市轨迹地图8. 历届夏奥会主办城市轨迹3D地图9. 历届冬奥会主办城市轨迹3D地图10. 历届夏奥会获奖国家分布时间线地图11. 历届冬奥会获奖国家分布时间线地图12. 历届夏奥会参赛国家分布时间线地图13. 历届冬奥会参赛国家分布时间线地图
2.3 趋势可视化1. 男性|女性|全体历届奥运会中国参赛人数折线图2. 男性|女性|全体历届奥运会中国参赛人数柱状折线图3. 历届夏奥会参赛国家数量时间线折线图4. 历届冬奥会参赛国家数量时间线折线图5. 历届夏奥会获奖国家数量时间线折线图6. 历届冬奥会获奖国家数量时间线折线图7. 历届夏奥会或冬奥会参赛|获奖国家数量时间线折线图
2.4 比例可视化1. 历届夏奥会参赛国家获奖比例堆叠柱状折线图2. 历届冬奥会参赛国家获奖比例堆叠柱状折线图
1 数据来源
Kaggle奥运会数据集,包括从1896年雅典奥运会到2016年里约热内卢的所有奥运赛事和运动员数据,可用于历届奥运会数据可视化。
链接:https://www.kaggle.com/heesoo37/120-years-of-olympic-history-athletes-and-results

2 数据可视化
2.1 数量可视化
1. 男性运动员年龄分布直方图
#[可视化]男性运动员年龄分布
import pandas as pd
from pyecharts import options as opts
from pyecharts.charts import Bar
from pyecharts.commons.utils import JsCode
# 将数据存储到列表中
athlete_df=pd.read_csv("./DataSet/History/athlete_events.csv")
df=athlete_df.groupby(['Sex','Age'])['ID'].count().reset_index()
m_age=df[df['Sex']=='M']['Age'].values.tolist()
m_age_num=df[df['Sex']=='M']['ID'].values.tolist()
c = (
Bar()
.add_xaxis(m_age)
.add_yaxis("", m_age_num, category_gap=0)
.set_series_opts(
itemstyle_opts={
"normal": {
"color": JsCode(
"""new echarts.graphic.LinearGradient(0, 0, 0, 1, [{
offset: 0,
color: 'rgba(0, 244, 255, 1)'
}, {
offset: 1,
color: 'rgba(0, 77, 167, 1)'
}], false)"""
),
"shadowColor": "rgb(0, 160, 221)",
}
},
label_opts=opts.LabelOpts(is_show=False),
markline_opts=opts.MarkLineOpts()
)
.set_global_opts(
title_opts=opts.TitleOpts(title="男性运动员年龄分布",pos_left='center'),
yaxis_opts=opts.AxisOpts(name='数量/个'),
xaxis_opts=opts.AxisOpts(name='年龄/岁')
)
.render("./Visual/[直方图]男性运动员年龄分布.html")
)

2. 女性运动员年龄分布直方图
#[可视化]女性运动员年龄分布
from pyecharts import options as opts
from pyecharts.charts import Bar
from pyecharts.commons.utils import JsCode
from pyecharts.faker import Faker
# 将数据存储到列表中
athlete_df=pd.read_csv("./DataSet/History/athlete_events.csv")
df=athlete_df.groupby(['Sex','Age'])['ID'].count().reset_index()
w_age=df[df['Sex']=='F']['Age'].values.tolist()
w_age_num=df[df['Sex']=='F']['ID'].values.tolist()
c = (
Bar()
.add_xaxis(w_age)
.add_yaxis("", w_age_num, category_gap=0)
.set_series_opts(
itemstyle_opts={
"normal": {
"color": JsCode(
"""new echarts.graphic.LinearGradient(0, 0, 0, 1, [{
offset: 0,
color: 'rgba(0, 244, 255, 1)'
}, {
offset: 1,
color: 'rgba(0, 77, 167, 1)'
}], false)"""
),
"shadowColor": "rgb(0, 160, 221)",
}
},
label_opts=opts.LabelOpts(is_show=False),
markline_opts=opts.MarkLineOpts()
)
.set_global_opts(
title_opts=opts.TitleOpts(title="女性运动员年龄分布",pos_left='center'),
yaxis_opts=opts.AxisOpts(name='数量/个'),
xaxis_opts=opts.AxisOpts(name='年龄/岁')
)
.render("./Visual/[直方图]女性运动员年龄分布.html")
)

3. 全体运动员年龄分布直方图
#[可视化]全体运动员年龄分布
from pyecharts import options as opts
from pyecharts.charts import Bar
from pyecharts.commons.utils import JsCode
from pyecharts.faker import Faker
# 将数据存储到列表中
athlete_df=pd.read_csv("./DataSet/History/athlete_events.csv")
df=athlete_df.groupby(['Age'])['ID'].count().reset_index()
age=df['Age'].values.tolist()
age_num=df['ID'].values.tolist()
c = (
Bar()
.add_xaxis(age)
.add_yaxis("", age_num, category_gap=0)
.set_series_opts(
itemstyle_opts={
"normal": {
"color": JsCode(
"""new echarts.graphic.LinearGradient(0, 0, 0, 1, [{
offset: 0,
color: 'rgba(0, 244, 255, 1)'
}, {
offset: 1,
color: 'rgba(0, 77, 167, 1)'
}], false)"""
),
"shadowColor": "rgb(0, 160, 221)",
}
},
label_opts=opts.LabelOpts(is_show=False),
markline_opts=opts.MarkLineOpts()
)
.set_global_opts(
title_opts=opts.TitleOpts(title="运动员年龄分布",pos_left='center'),
yaxis_opts=opts.AxisOpts(name='数量/个'),
xaxis_opts=opts.AxisOpts(name='年龄/岁')
)
.render("./Visual/[直方图]运动员年龄分布.html")
)

4. 男性运动员身高体重分布散点图
#[可视化]男性运动员身高体重
import pandas as pd
from pyecharts import options as opts
from pyecharts.charts import Scatter
# 将数据存储到列表中
athlete_df=pd.read_csv("./DataSet/History/athlete_events.csv")
athlete_df=athlete_df[athlete_df['Sex']=='M']
df=athlete_df[['Height','Weight']].drop_duplicates().dropna()
df=df.sort_values(by=['Weight'])
height=df['Height'].values.tolist()
weight=df['Weight'].values.tolist()
c = (
Scatter()
.add_xaxis(weight)
.add_yaxis("", height,symbol_size=7)
.set_series_opts(
label_opts=opts.LabelOpts(is_show=False)
)
.set_global_opts(
title_opts=opts.TitleOpts(title="男性运动员身高体重分布",pos_left='center'),
xaxis_opts=opts.AxisOpts(min_=35,max_=60,name='Weight'),
yaxis_opts=opts.AxisOpts(max_=220,min_=100,name='Height')
)
.render("./Visual/[散点图]男性运动员身高体重.html")
)

5. 女性运动员身高体重分布散点图
#[可视化]女性运动员身高体重
import pandas as pd
from pyecharts import options as opts
from pyecharts.charts import Scatter
# 将数据存储到列表中
athlete_df=pd.read_csv("./DataSet/History/athlete_events.csv")
athlete_df=athlete_df[athlete_df['Sex']=='F']
df=athlete_df[['Height','Weight']].drop_duplicates().dropna()
df=df.sort_values(by=['Weight'])
height=df['Height'].values.tolist()
weight=df['Weight'].values.tolist()
c = (
Scatter()
.add_xaxis(weight)
.add_yaxis("", height,symbol_size=7)
.set_series_opts(
label_opts=opts.LabelOpts(is_show=False)
)
.set_global_opts(
title_opts=opts.TitleOpts(title="女性运动员身高体重分布",pos_left='center'),
xaxis_opts=opts.AxisOpts(max_=50, min_=30, name='Weight'),
yaxis_opts=opts.AxisOpts(max_=220,min_=100,name='Height')
)
.render("./Visual/[散点图]女性运动员身高体重.html")
)

6. 全体运动员身高体重分布散点图
#[可视化]全体运动员身高体重
import pandas as pd
from pyecharts import options as opts
from pyecharts.charts import Scatter
# 将数据存储到列表中
athlete_df=pd.read_csv("./DataSet/History/athlete_events.csv")
df=athlete_df[['Height','Weight']].drop_duplicates().dropna()
df=df.sort_values(by=['Weight'])
height=df['Height'].values.tolist()
weight=df['Weight'].values.tolist()
c = (
Scatter()
.add_xaxis(weight)
.add_yaxis("", height,symbol_size=7)
.set_series_opts(
label_opts=opts.LabelOpts(is_show=False)
)
.set_global_opts(
title_opts=opts.TitleOpts(title="全体运动员身高体重分布",pos_left='center'),
xaxis_opts=opts.AxisOpts(max_=80, min_=28, name='Weight'),
yaxis_opts=opts.AxisOpts(max_=220,min_=100,name='Height')
)
.render("./Visual/[散点图]全体运动员身高体重.html")
)

2.2 地理可视化
1. 历届奥运会各国运动员分布轮播地图
利用Pandas将历届运动员数据按照年份和国家聚类: 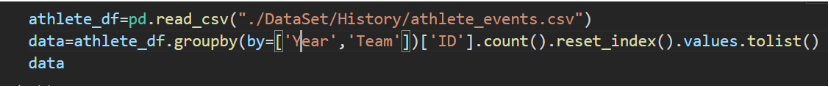 以1896年为例,筛选1896年的各国家参赛运动员数据: 以1896年为例,筛选1896年的各国家参赛运动员数据:  利用Pandas统计奥运会举办年份数量: 利用Pandas统计奥运会举办年份数量:  利用Timeline和Map图表进行可视化: 利用Timeline和Map图表进行可视化:
#[可视化]历届奥运会各国运动员分布自动轮播地图
from pyecharts import options as opts
from pyecharts.charts import Map,Timeline
# 统计年份数量
athlete_df=pd.read_csv("./DataSet/History/athlete_events.csv")
data=athlete_df.groupby(by=['Year','Team'])['ID'].count().reset_index()
count=len(athlete_df['Year'].unique())
years=athlete_df['Year'].sort_values().unique().tolist()
timeline =(
Timeline()
.add_schema(
is_auto_play=True,
is_loop_play=True,
is_timeline_show=True,
play_interval=500
)
)
for i in range(count):
year=years[i]
data_list=data[data['Year']==year][['Team','ID']].values.tolist()
map=(
Map()
.add("", data_list, "world",
is_map_symbol_show=False,
)
.set_series_opts(label_opts=opts.LabelOpts(is_show=False))
.set_global_opts(
title_opts=opts.TitleOpts(title="历届奥运会各国运动员分布图————{}年".format(years[i])),
visualmap_opts=opts.VisualMapOpts(max_=500,range_color=['#feeeed','#d71345'])
)
)
timeline.add(map,'{}'.format(years[i]))
timeline.render("./Visual/[时间线地图]各国运动员分布图.html")
  
2. 历届夏奥会各国运动员分布轮播地图
利用Pandas筛选季节为Summer的数据: 
#[可视化]历届夏奥会各国运动员分布自动轮播地图
from pyecharts import options as opts
from pyecharts.charts import Map,Timeline
# 统计年份数量
athlete_df=pd.read_csv("./DataSet/History/athlete_events.csv")
athlete_df=athlete_df[athlete_df['Season']=='Summer']
data=athlete_df.groupby(by=['Year','Team'])['ID'].count().reset_index()
count=len(athlete_df['Year'].unique())
years=athlete_df['Year'].sort_values().unique().tolist()
timeline =(
Timeline()
.add_schema(
is_auto_play=True,
is_loop_play=True,
is_timeline_show=True,
play_interval=500,
checkpointstyle_opts=opts.TimelineCheckPointerStyle(color='#ef4136',border_color='#ffce7b')
)
)
for i in range(count):
year=years[i]
data_list=data[data['Year']==year][['Team','ID']].values.tolist()
map=(
Map()
.add("", data_list, "world",
is_map_symbol_show=False,
)
.set_series_opts(label_opts=opts.LabelOpts(is_show=False))
.set_global_opts(
title_opts=opts.TitleOpts(title="历届夏奥会各国运动员分布图————{}年".format(years[i])),
visualmap_opts=opts.VisualMapOpts(max_=500,range_color=['#ffce7b','#ef4136'])
)
)
timeline.add(map,'{}'.format(years[i]))
timeline.render("./Visual/[时间线地图]夏奥会各国运动员分布图.html")
 
3. 历届冬奥会各国运动员分布轮播地图
#[可视化]历届冬奥会各国运动员分布自动轮播地图
from pyecharts import options as opts
from pyecharts.charts import Map,Timeline
import pandas as pd
# 统计年份数量
athlete_df=pd.read_csv("./DataSet/History/athlete_events.csv")
athlete_df=athlete_df[athlete_df['Season']=='Winter']
data=athlete_df.groupby(by=['Year','Team'])['ID'].count().reset_index()
count=len(athlete_df['Year'].unique())
years=athlete_df['Year'].sort_values().unique().tolist()
timeline =(
Timeline()
.add_schema(
is_auto_play=True,
is_loop_play=True,
is_timeline_show=True,
play_interval=500,
checkpointstyle_opts=opts.TimelineCheckPointerStyle(color='#6950a1',border_color='#9b95c9')
)
)
for i in range(count):
year=years[i]
data_list=data[data['Year']==year][['Team','ID']].values.tolist()
map=(
Map()
.add("", data_list, "world",
is_map_symbol_show=False,
)
.set_series_opts(label_opts=opts.LabelOpts(is_show=False))
.set_global_opts(
title_opts=opts.TitleOpts(title="历届冬奥会各国运动员分布图————{}年".format(years[i])),
visualmap_opts=opts.VisualMapOpts(max_=500,range_color=['#afb4db','#6f599c'])
)
)
timeline.add(map,'{}'.format(years[i]))
timeline.render("./Visual/[时间线地图]冬奥会各国运动员分布图.html")
 
4. 历届夏奥会主办城市地图
利用Pandas获取历届夏奥会主办城市:  收集各个主办城市的经纬度: 收集各个主办城市的经纬度:  将城市经纬度数据转换为json格式并写入文件: 将城市经纬度数据转换为json格式并写入文件: 
#[可视化]历届夏奥会主办城市地图
from pyecharts import options as opts
from pyecharts.charts import Geo
from pyecharts.globals import ChartType, SymbolType
athlete_df=pd.read_csv("./DataSet/History/athlete_events.csv")
athlete_df=athlete_df[athlete_df['Season']=='Summer']
city_df=athlete_df[['Year','City']].drop_duplicates().sort_values(by=['Year'])
# 获取城市
cities=city_df[['City','Year']].values.tolist()
locs=[]
for city in cities:
locs.append(tuple(city))
# print(locs)
c = (
Geo()
.add_schema(
maptype="world",
# itemstyle_opts=opts.ItemStyleOpts(color="#323c48", border_color="#111"),
)
.add_coordinate_json("./DataSet/Location/Summer_City.json")
.add(
"",
locs,
type_=ChartType.EFFECT_SCATTER,
color="red",
)
.set_series_opts(label_opts=opts.LabelOpts(is_show=False))
.set_global_opts(
title_opts=opts.TitleOpts(title='历届夏奥会主办城市地图',pos_left='center')
)
.render("./Visual/[地理坐标图]历届夏奥会主办城市地图.html")
)

5. 历届冬奥会主办城市地图
#[可视化]历届冬奥会主办城市地图
from pyecharts import options as opts
from pyecharts.charts import Geo
from pyecharts.globals import ChartType, SymbolType
athlete_df=pd.read_csv("./DataSet/History/athlete_events.csv")
athlete_df=athlete_df[athlete_df['Season']=='Winter']
city_df=athlete_df[['Year','City']].drop_duplicates().sort_values(by=['Year'])
# 获取城市
cities=city_df[['City','Year']].values.tolist()
locs=[]
for city in cities:
locs.append(tuple(city))
# print(locs)
c = (
Geo()
.add_schema(
maptype="world",
# itemstyle_opts=opts.ItemStyleOpts(color="#323c48", border_color="#111"),
)
.add_coordinate_json("./DataSet/Location/Winter_City.json")
.add(
"",
locs,
type_=ChartType.EFFECT_SCATTER,
color="#4e72b8",
)
.set_series_opts(label_opts=opts.LabelOpts(is_show=False))
.set_global_opts(
title_opts=opts.TitleOpts(title='历届冬奥会主办城市地图',pos_left='center')
)
.render("./Visual/[地理坐标图]历届冬奥会主办城市地图.html")
)

6. 历届夏奥会主办城市轨迹地图
#[可视化]历届夏奥会主办城市轨迹地图
from pyecharts import options as opts
from pyecharts.charts import Geo
from pyecharts.globals import ChartType, SymbolType
athlete_df=pd.read_csv("./DataSet/History/athlete_events.csv")
athlete_df=athlete_df[athlete_df['Season']=='Summer']
city_df=athlete_df[['Year','City']].drop_duplicates().sort_values(by=['Year'])
# 获取城市
cities=city_df[['City','Year']].values.tolist()
locs=[]
for city in cities:
locs.append(tuple(city))
# print(locs)
# 获取轨迹
city_list=list(city_df['City'])
lines=[]
for i in range(len(city_list)-1):
lines.append(tuple([city_list[i],city_list[i+1]]))
# print(lines)
c = (
Geo()
.add_schema(
maptype="world",
itemstyle_opts=opts.ItemStyleOpts(color="#323c48", border_color="#111"),
)
.add_coordinate_json("./DataSet/Location/Summer_City.json")
.add(
"",
locs,
type_=ChartType.EFFECT_SCATTER,
color="white",
)
.add(
"",
lines,
type_=ChartType.LINES,
effect_opts=opts.EffectOpts(
symbol=SymbolType.ARROW, symbol_size=6, color="blue"
),
linestyle_opts=opts.LineStyleOpts(curve=0.2),
)
.set_series_opts(label_opts=opts.LabelOpts(is_show=False))
.set_global_opts(
title_opts=opts.TitleOpts(title='历届夏奥会主办城市轨迹地图',pos_left='center')
)
.render("./Visual/[地理坐标图]历届夏奥会主办城市轨迹地图.html")
)

7. 历届冬奥会主办城市轨迹地图
#[可视化]历届冬奥会主办城市轨迹地图
from pyecharts import options as opts
from pyecharts.charts import Geo
from pyecharts.globals import ChartType, SymbolType
athlete_df=pd.read_csv("./DataSet/History/athlete_events.csv")
athlete_df=athlete_df[athlete_df['Season']=='Winter']
city_df=athlete_df[['Year','City']].drop_duplicates().sort_values(by=['Year'])
# 获取城市
cities=city_df[['City','Year']].values.tolist()
locs=[]
for city in cities:
locs.append(tuple(city))
# print(locs)
# 获取轨迹
city_list=list(city_df['City'])
lines=[]
for i in range(len(city_list)-1):
lines.append(tuple([city_list[i],city_list[i+1]]))
# print(lines)
c = (
Geo()
.add_schema(
maptype="world",
itemstyle_opts=opts.ItemStyleOpts(color="#323c48", border_color="#111"),
)
.add_coordinate_json("./DataSet/Location/Winter_City.json")
.add(
"",
locs,
type_=ChartType.EFFECT_SCATTER,
color="white",
)
.add(
"",
lines,
type_=ChartType.LINES,
effect_opts=opts.EffectOpts(
symbol=SymbolType.ARROW, symbol_size=6, color="yellow"
),
linestyle_opts=opts.LineStyleOpts(curve=0.2),
)
.set_series_opts(label_opts=opts.LabelOpts(is_show=False))
.set_global_opts(
title_opts=opts.TitleOpts(title='历届冬奥会主办城市轨迹地图',pos_left='center')
)
.render("./Visual/[地理坐标图]历届冬奥会主办城市轨迹地图.html")
)

8. 历届夏奥会主办城市轨迹3D地图
#[可视化]历届夏奥会主办城市轨迹3D地图
from pyecharts import options as opts
from pyecharts.charts import Map3D
from pyecharts.globals import ChartType
import pandas as pd
summer_city=pd.read_csv("./DataSet/Location/Summer_City.csv",header=None)
cities_location=summer_city[[1,2]].values.tolist()
data=[]
for i in range(len(cities_location)-1):
data.append([cities_location[i],cities_location[i+1]])
c = (
Map3D(init_opts=opts.InitOpts(width='1000px',height='700px'))
.add_schema(
maptype="world",
box_depth=70,
itemstyle_opts=opts.ItemStyleOpts(
color="rgb(5,101,123)",
opacity=1,
border_width=0.8,
border_color="rgb(62,215,213)",
),
light_opts=opts.Map3DLightOpts(
main_color="#fff",
main_intensity=1.2,
is_main_shadow=False,
main_alpha=55,
main_beta=10,
ambient_intensity=0.3,
),
post_effect_opts=opts.Map3DPostEffectOpts(is_enable=True),
)
.add(
series_name="",
data_pair=data,
type_=ChartType.LINES3D,
effect=opts.Lines3DEffectOpts(
is_show=True,
period=4,
trail_width=3,
trail_length=0.5,
trail_color="#f00",
trail_opacity=1,
),
linestyle_opts=opts.LineStyleOpts(is_show=False, color="#fff", opacity=0),
)
.set_global_opts(title_opts=opts.TitleOpts(title="历届夏奥会主办城市轨迹3D地图"))
.render("./Visual/[地理坐标图]历届夏奥会主办城市轨迹3D地图.html")
)

9. 历届冬奥会主办城市轨迹3D地图
#[可视化]历届冬奥会主办城市轨迹3D地图
from pyecharts import options as opts
from pyecharts.charts import Map3D
from pyecharts.globals import ChartType
import pandas as pd
winter_city=pd.read_csv("./DataSet/Location/Winter_city.csv",header=None)
cities_location=winter_city[[1,2]].values.tolist()
data=[]
for i in range(len(cities_location)-1):
data.append([cities_location[i],cities_location[i+1]])
c = (
Map3D(init_opts=opts.InitOpts(width='1000px',height='700px'))
.add_schema(
maptype="world",
box_depth=70,
itemstyle_opts=opts.ItemStyleOpts(
color="rgb(5,101,123)",
opacity=1,
border_width=0.8,
border_color="rgb(62,215,213)",
),
light_opts=opts.Map3DLightOpts(
main_color="#fff",
main_intensity=1.2,
is_main_shadow=False,
main_alpha=55,
main_beta=10,
ambient_intensity=0.3,
),
post_effect_opts=opts.Map3DPostEffectOpts(is_enable=True),
)
.add(
series_name="",
data_pair=data,
type_=ChartType.LINES3D,
effect=opts.Lines3DEffectOpts(
is_show=True,
period=4,
trail_width=3,
trail_length=0.5,
trail_color="#f00",
trail_opacity=1,
),
linestyle_opts=opts.LineStyleOpts(is_show=False, color="#fff", opacity=0),
)
.set_global_opts(title_opts=opts.TitleOpts(title="历届冬奥会主办城市轨迹3D地图"))
.render("./Visual/[地理坐标图]历届冬奥会主办城市轨迹3D地图.html")
)

10. 历届夏奥会获奖国家分布时间线地图
#[可视化]历届夏奥会获奖国家分布自动轮播地图
from pyecharts import options as opts
from pyecharts.charts import Map,Timeline
# 统计年份数量
athlete_df=pd.read_csv("./DataSet/History/athlete_events.csv")
count_df=athletes_df[athletes_df['Season']=='Summer'].groupby(['Year','Team'])['Medal'].count().reset_index()
count_df['value']=1
count=len(count_df['Year'].unique())
years=count_df['Year'].sort_values().unique().tolist()
timeline =(
Timeline()
.add_schema(
is_auto_play=True,
is_loop_play=True,
is_timeline_show=True,
play_interval=500,
checkpointstyle_opts=opts.TimelineCheckPointerStyle(color='#6950a1',border_color='#9b95c9')
)
)
for i in range(count):
year=years[i]
data_list=count_df.loc[(count_df['Year']==year)&(count_df['Medal']!=0),['Team','value']].values.tolist()
map=(
Map()
.add("", data_list, "world",
is_map_symbol_show=False,
)
.set_series_opts(label_opts=opts.LabelOpts(is_show=False))
.set_global_opts(
title_opts=opts.TitleOpts(title="历届夏奥会获奖国家分布图————{}年".format(years[i])),
visualmap_opts=opts.VisualMapOpts(is_show=False,range_color=['#9b95c9','#6f599c'])
)
)
timeline.add(map,'{}'.format(years[i]))
timeline.render("./Visual/[时间线地图]历届夏奥会获奖国家分布图.html")

11. 历届冬奥会获奖国家分布时间线地图
#[可视化]历届冬奥会获奖国家分布自动轮播地图
from pyecharts import options as opts
from pyecharts.charts import Map,Timeline
# 统计年份数量
athlete_df=pd.read_csv("./DataSet/History/athlete_events.csv")
count_df=athletes_df[athletes_df['Season']=='Winter'].groupby(['Year','Team'])['Medal'].count().reset_index()
count_df['value']=1
count=len(count_df['Year'].unique())
years=count_df['Year'].sort_values().unique().tolist()
timeline =(
Timeline()
.add_schema(
is_auto_play=True,
is_loop_play=True,
is_timeline_show=True,
play_interval=500,
checkpointstyle_opts=opts.TimelineCheckPointerStyle(color='#4e72b8',border_color='#90d7ec')
)
)
for i in range(count):
year=years[i]
data_list=count_df.loc[(count_df['Year']==year)&(count_df['Medal']!=0),['Team','value']].values.tolist()
map=(
Map()
.add("", data_list, "world",
is_map_symbol_show=False,
)
.set_series_opts(label_opts=opts.LabelOpts(is_show=False))
.set_global_opts(
title_opts=opts.TitleOpts(title="历届冬奥会获奖国家分布图————{}年".format(years[i])),
visualmap_opts=opts.VisualMapOpts(is_show=False)
)
)
timeline.add(map,'{}'.format(years[i]))
timeline.render("./Visual/[时间线地图]历届冬奥会获奖国家分布图.html")

12. 历届夏奥会参赛国家分布时间线地图
#[可视化]历届夏奥会参赛国家分布自动轮播地图
from pyecharts import options as opts
from pyecharts.charts import Map,Timeline
# 统计年份数量
athlete_df=pd.read_csv("./DataSet/History/athlete_events.csv")
count_df=athletes_df[athletes_df['Season']=='Summer'].groupby(['Year','Team'])['Medal'].count().reset_index()
count_df['value']=1
count=len(count_df['Year'].unique())
years=count_df['Year'].sort_values().unique().tolist()
timeline =(
Timeline()
.add_schema(
is_auto_play=True,
is_loop_play=True,
is_timeline_show=True,
play_interval=500,
checkpointstyle_opts=opts.TimelineCheckPointerStyle(color='#fcaf17',border_color='#ffce7b')
)
)
for i in range(count):
year=years[i]
data_list=count_df.loc[count_df['Year']==year,['Team','value']].values.tolist()
map=(
Map()
.add("", data_list, "world",
is_map_symbol_show=False,
)
.set_series_opts(label_opts=opts.LabelOpts(is_show=False))
.set_global_opts(
title_opts=opts.TitleOpts(title="历届夏奥会参赛国家分布图————{}年".format(years[i])),
visualmap_opts=opts.VisualMapOpts(is_show=False,range_color=['#fdb933','#6f599c'])
)
)
timeline.add(map,'{}'.format(years[i]))
timeline.render("./Visual/[时间线地图]历届夏奥会参赛国家分布图.html")

13. 历届冬奥会参赛国家分布时间线地图
#[可视化]历届冬奥会参赛国家分布自动轮播地图
from pyecharts import options as opts
from pyecharts.charts import Map,Timeline
# 统计年份数量
athlete_df=pd.read_csv("./DataSet/History/athlete_events.csv")
count_df=athletes_df[athletes_df['Season']=='Winter'].groupby(['Year','Team'])['Medal'].count().reset_index()
count_df['value']=1
count=len(count_df['Year'].unique())
years=count_df['Year'].sort_values().unique().tolist()
timeline =(
Timeline()
.add_schema(
is_auto_play=True,
is_loop_play=True,
is_timeline_show=True,
play_interval=500,
checkpointstyle_opts=opts.TimelineCheckPointerStyle(color='#00ae9d',border_color='#afdfe4')
)
)
for i in range(count):
year=years[i]
data_list=count_df.loc[count_df['Year']==year,['Team','value']].values.tolist()
map=(
Map()
.add("", data_list, "world",
is_map_symbol_show=False,
)
.set_series_opts(label_opts=opts.LabelOpts(is_show=False))
.set_global_opts(
title_opts=opts.TitleOpts(title="历届冬奥会参赛国家分布图————{}年".format(years[i])),
visualmap_opts=opts.VisualMapOpts(is_show=False,range_color=['#00ae9d','#6f599c'])
)
)
timeline.add(map,'{}'.format(years[i]))
timeline.render("./Visual/[时间线地图]历届冬奥会参赛国家分布图.html")

2.3 趋势可视化
1. 男性|女性|全体历届奥运会中国参赛人数折线图
利用Pandas得到中国历届奥运会男性|女性|全体参赛人数: 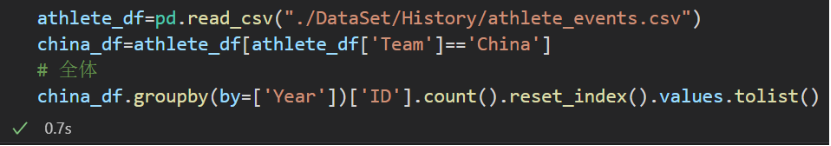   观察发现,在1932年和1952年没有女性运动员,因此对数据进行补充: 观察发现,在1932年和1952年没有女性运动员,因此对数据进行补充: 
#[可视化]男性|女性|全体历届奥运会中国参赛人数折线图
import pandas as pd
from pyecharts.charts import Line,Timeline
import pyecharts.options as opts
from pyecharts.globals import ThemeType,JsCode
athlete_df=pd.read_csv("./DataSet/History/athlete_events.csv")
china_df=athlete_df[athlete_df['Team']=='China']
# 全体
all_df=china_df.groupby(by=['Year'])['ID'].count().reset_index()
all=china_df.groupby(by=['Year'])['ID'].count().reset_index().values.tolist()
# 男性
male_df=china_df[china_df['Sex']=='M']
male=male_df.groupby(by=['Year'])['ID'].count().reset_index().values.tolist()
# 女性
female_df=china_df[china_df['Sex']=='F']
female=female_df.groupby(by=['Year'])['ID'].count().reset_index()
# 在1932年和1952年没有女性运动员
lost=pd.DataFrame({'Year':[1932,1952],'ID':[0,0]})
female=female.append(lost,ignore_index=True).sort_values(by=['Year']).values.tolist()
# 背景色
background_color_js = (
"new echarts.graphic.LinearGradient(0, 0, 0, 1, "
"[{offset: 0, color: '#c86589'}, {offset: 1, color: '#06a7ff'}], false)"
)
# 线条样式
linestyle_dic = { 'normal': {
'width': 4,
'shadowColor': '#696969',
'shadowBlur': 10,
'shadowOffsetY': 10,
'shadowOffsetX': 10,
}
}
timeline = Timeline(init_opts=opts.InitOpts(width='980px',height='600px'))
timeline.add_schema(is_auto_play=True, is_loop_play=True,
is_timeline_show=True, play_interval=500)
ALL, MALE, FEMALE = [], [], []
x_data=all_df['Year'].values.tolist()
x=[]
for i in x_data:
x.append(str(i))
print(x)
for i in range(len(x)):
ALL.append(all[i][1])
# print(ALL)
MALE.append(male[i][1])
# print(MALE)
FEMALE.append(female[i][1])
# print(FEMALE)
line = (
Line(init_opts=opts.InitOpts(
width='980px',height='600px'))
.add_xaxis(x)
# 全体线条
.add_yaxis(
'全体',
ALL,
symbol_size=10,
is_smooth=True,
label_opts=opts.LabelOpts(is_show=True),
markpoint_opts=opts.MarkPointOpts(
data=[ opts.MarkPointItem(
name="",
type_='max',
value_index=0,
symbol_size=[40, 25],
)],
label_opts=opts.LabelOpts(is_show=False),
)
)
# 男性线条
.add_yaxis(
'男性',
MALE,
symbol_size=5,
is_smooth=True,
label_opts=opts.LabelOpts(is_show=True),
markpoint_opts=opts.MarkPointOpts(
data=[
opts.MarkPointItem(
name="",
type_='max',
value_index=0,
symbol_size=[40, 25],
)
],
label_opts=opts.LabelOpts(is_show=False),
)
)
# 女性线条
.add_yaxis(
'女性',
FEMALE,
symbol_size=5,
is_smooth=True,
label_opts=opts.LabelOpts(is_show=True),
markpoint_opts=opts.MarkPointOpts(
data=[opts.MarkPointItem(
name="",
type_='max',
value_index=0,
symbol_size=[40, 25],
)],
label_opts=opts.LabelOpts(is_show=False),
)
)
.set_series_opts(linestyle_opts=linestyle_dic)
.set_global_opts(
title_opts=opts.TitleOpts(
title='男性|女性|全体历届奥运会中国参赛人数折线图',
pos_left='center',
pos_top='2%',
title_textstyle_opts=opts.TextStyleOpts(
color='#DC143C', font_size=20)
),
xaxis_opts=opts.AxisOpts(axislabel_opts=opts.LabelOpts(font_size=14, color='red'),
axisline_opts=opts.AxisLineOpts(is_show=True,
linestyle_opts=opts.LineStyleOpts(width=2, color='#DB7093'))),
yaxis_opts=opts.AxisOpts(
name='数量/人',
is_scale=True,
max_=750,
name_textstyle_opts=opts.TextStyleOpts(font_size=16,font_weight='bold',color='#DC143C'),
axislabel_opts=opts.LabelOpts(font_size=13),
splitline_opts=opts.SplitLineOpts(is_show=True,
linestyle_opts=opts.LineStyleOpts(type_='dashed')),
axisline_opts=opts.AxisLineOpts(is_show=True,
linestyle_opts=opts.LineStyleOpts(width=2, color='#DB7093'))
),
legend_opts=opts.LegendOpts(is_show=True, pos_right='1%', pos_top='2%',
legend_icon='roundRect',orient = 'vertical'),
))
timeline.add(line, '{}'.format(x[i]))
timeline.render("./Visual/[时间线折线图]男性-女性-全体历届奥运会中国参赛人数折线图.html")

2. 男性|女性|全体历届奥运会中国参赛人数柱状折线图
#[可视化]男性|女性|全体历届奥运会中国参赛人数柱状折线图
import pandas as pd
from pyecharts.charts import Bar
import pyecharts.options as opts
from pyecharts.globals import ThemeType,JsCode
athlete_df=pd.read_csv("./DataSet/History/athlete_events.csv")
china_df=athlete_df[athlete_df['Team']=='China']
# 全体
all_df=china_df.groupby(by=['Year'])['ID'].count().reset_index()
all=china_df.groupby(by=['Year'])['ID'].count().reset_index()['ID'].values.tolist()
# 男性
male_df=china_df[china_df['Sex']=='M']
male=male_df.groupby(by=['Year'])['ID'].count().reset_index()['ID'].values.tolist()
# 女性
female_df=china_df[china_df['Sex']=='F']
female=female_df.groupby(by=['Year'])['ID'].count().reset_index()
# 在1932年和1952年没有女性运动员
lost=pd.DataFrame({'Year':[1932,1952],'ID':[0,0]})
female=female.append(lost,ignore_index=True).sort_values(by=['Year'])['ID'].values.tolist()
# x轴数据
x_data=all_df['Year'].values.tolist()
x=[]
for i in x_data:
x.append(str(i))
bar=(
Bar()
.add_xaxis(x)
.add_yaxis("男性", male, gap="0%")
.add_yaxis("女性", female, gap="0%")
.extend_axis(
yaxis=opts.AxisOpts(
axislabel_opts=opts.LabelOpts(formatter="{value}"), interval=100, name='总人数/人'
)
)
.set_series_opts(
label_opts=opts.LabelOpts(is_show=False)
)
.set_global_opts(
title_opts=opts.TitleOpts(title="男性|女性|全体历届奥运会中国参赛人数柱状折线图"),
yaxis_opts=opts.AxisOpts(max_=800,name='人数/人',axislabel_opts=opts.LabelOpts(formatter="{value}")),
legend_opts=opts.LegendOpts(pos_left='right'),
datazoom_opts=opts.DataZoomOpts()
)
)
line = Line().add_xaxis(x).add_yaxis("全体", all, yaxis_index=1)
bar.overlap(line)
bar.render("./Visual/[柱状折线图]男性-女性-全体历届奥运会中国参赛人数柱状折线图.html")

3. 历届夏奥会参赛国家数量时间线折线图
利用Pandas从CSV中获取各国家在各年份的奖牌数量:   
#[可视化]历届夏奥会参赛国家数量趋势
from pyecharts import options as opts
from pyecharts.charts import Line,Timeline
from pyecharts.globals import ThemeType,JsCode
# 统计各国家在各年份的奖牌数量
athletes_df=pd.read_csv("./DataSet/History/athlete_events.csv")
summer_count_df=athletes_df[athletes_df['Season']=='Summer'].groupby(['Year','Team'])['Medal'].count().reset_index()
# 获取历届夏奥会参赛国家数量
engage_data=[]
years=summer_count_df['Year'].drop_duplicates()
for year in years:
engage_data.append([year,summer_count_df.loc[summer_count_df['Year']==year].shape[0]])
# 线条样式
linestyle_dic = {'normal': {
'width': 4,
'shadowColor': '#696969',
'shadowBlur': 10,
'shadowOffsetY': 10,
'shadowOffsetX': 10,
}
}
timeline = Timeline().add_schema(is_auto_play=True, is_loop_play=False,is_timeline_show=True, play_interval=500)
data = []
x_data = []
for year in years:
x_data.append(str(year))
for i in range(len(x_data)):
data.append(engage_data[i][-1])
line = (
Line()
.add_xaxis(x_data)
.add_yaxis(
'',
data,
symbol_size=10,
is_smooth=True,
label_opts=opts.LabelOpts(is_show=True),
markpoint_opts=opts.MarkPointOpts(
data=[opts.MarkPointItem(
name="",
type_='max',
value_index=0,
symbol_size=[40, 25],
)],
label_opts=opts.LabelOpts(is_show=False),
)
)
.set_series_opts(linestyle_opts=linestyle_dic, label_opts=opts.LabelOpts(font_size=12))
.set_global_opts(
title_opts=opts.TitleOpts(
title='历届夏奥会参赛国家数量趋势',
title_textstyle_opts=opts.TextStyleOpts(font_size=20)),
xaxis_opts=opts.AxisOpts(axislabel_opts=opts.LabelOpts(font_size=14),
axisline_opts=opts.AxisLineOpts(is_show=True,
linestyle_opts=opts.LineStyleOpts(width=2))),
yaxis_opts=opts.AxisOpts(
is_scale=True,
name_textstyle_opts=opts.TextStyleOpts(
font_size=16, font_weight='bold'),
axislabel_opts=opts.LabelOpts(
font_size=13),
splitline_opts=opts.SplitLineOpts(is_show=True,
linestyle_opts=opts.LineStyleOpts(type_='dashed')),
axisline_opts=opts.AxisLineOpts(is_show=True,
linestyle_opts=opts.LineStyleOpts(width=2))
),
legend_opts=opts.LegendOpts(is_show=True, pos_right='1%', pos_top='2%',legend_icon='roundRect'),
)
)
timeline.add(line, '{}'.format(engage_data[i][0]))
timeline.render("./Visual/[时间线折线图]历届夏奥会参赛国家数量趋势.html")

4. 历届冬奥会参赛国家数量时间线折线图
#[可视化]历届冬奥会参赛国家数量趋势
from pyecharts import options as opts
from pyecharts.charts import Line,Timeline
from pyecharts.globals import ThemeType,JsCode
# 统计各国家在各年份的奖牌数量
athletes_df=pd.read_csv("./DataSet/History/athlete_events.csv")
winter_count_df=athletes_df[athletes_df['Season']=='Winter'].groupby(['Year','Team'])['Medal'].count().reset_index()
# 获取历届冬奥会参赛国家数量
engage_data=[]
years=winter_count_df['Year'].drop_duplicates()
for year in years:
engage_data.append([year,winter_count_df.loc[winter_count_df['Year']==year].shape[0]])
# 线条样式
linestyle_dic = {'normal': {
'width': 4,
'shadowColor': '#696969',
'shadowBlur': 10,
'shadowOffsetY': 10,
'shadowOffsetX': 10,
}
}
timeline = Timeline().add_schema(is_auto_play=True, is_loop_play=False,is_timeline_show=True, play_interval=500)
data = []
x_data = []
for year in years:
x_data.append(str(year))
for i in range(len(x_data)):
data.append(engage_data[i][-1])
line = (
Line()
.add_xaxis(x_data)
.add_yaxis(
'',
data,
symbol_size=10,
is_smooth=True,
label_opts=opts.LabelOpts(is_show=True),
markpoint_opts=opts.MarkPointOpts(
data=[opts.MarkPointItem(
name="",
type_='max',
value_index=0,
symbol_size=[40, 25],
)],
label_opts=opts.LabelOpts(is_show=False),
)
)
.set_series_opts(linestyle_opts=linestyle_dic, label_opts=opts.LabelOpts(font_size=12))
.set_global_opts(
title_opts=opts.TitleOpts(
title='历届冬奥会参赛国家数量趋势',
title_textstyle_opts=opts.TextStyleOpts(font_size=20)),
xaxis_opts=opts.AxisOpts(axislabel_opts=opts.LabelOpts(font_size=14),
axisline_opts=opts.AxisLineOpts(is_show=True,
linestyle_opts=opts.LineStyleOpts(width=2))),
yaxis_opts=opts.AxisOpts(
is_scale=True,
name_textstyle_opts=opts.TextStyleOpts(
font_size=16, font_weight='bold'),
axislabel_opts=opts.LabelOpts(
font_size=13),
splitline_opts=opts.SplitLineOpts(is_show=True,
linestyle_opts=opts.LineStyleOpts(type_='dashed')),
axisline_opts=opts.AxisLineOpts(is_show=True,
linestyle_opts=opts.LineStyleOpts(width=2))
),
legend_opts=opts.LegendOpts(is_show=True, pos_right='1%', pos_top='2%',legend_icon='roundRect'),
)
)
timeline.add(line, '{}'.format(engage_data[i][0]))
timeline.render("./Visual/[时间线折线图]历届冬奥会参赛国家数量趋势.html")

5. 历届夏奥会获奖国家数量时间线折线图
#[可视化]历届夏奥会获奖国家数量趋势
from pyecharts import options as opts
from pyecharts.charts import Line,Timeline
from pyecharts.globals import ThemeType,JsCode
# 统计各国家在各年份的奖牌数量
athletes_df=pd.read_csv("./DataSet/History/athlete_events.csv")
summer_count_df=athletes_df[athletes_df['Season']=='Summer'].groupby(['Year','Team'])['Medal'].count().reset_index()
# 获取历届夏奥会获奖国家数量
medals_data=[]
years=summer_count_df['Year'].drop_duplicates()
for year in years:
medals_data.append([year,summer_count_df.loc[(summer_count_df['Year']==year)&(summer_count_df['Medal']!=0)].shape[0]])
# 线条样式
linestyle_dic = {'normal': {
'width': 4,
'color':'#6950a1',
'shadowColor': '#696969',
'shadowBlur': 10,
'shadowOffsetY': 10,
'shadowOffsetX': 10,
}
}
timeline = Timeline().add_schema(is_auto_play=True, is_loop_play=False,is_timeline_show=True, play_interval=500)
data = []
x_data = []
for year in years:
x_data.append(str(year))
for i in range(len(x_data)):
data.append(medals_data[i][-1])
line = (
Line()
.add_xaxis(x_data)
.add_yaxis(
'',
data,
symbol_size=10,
is_smooth=True,
label_opts=opts.LabelOpts(is_show=True),
markpoint_opts=opts.MarkPointOpts(
data=[opts.MarkPointItem(
name="",
type_='max',
value_index=0,
symbol_size=[40, 25],
itemstyle_opts=opts.ItemStyleOpts(color='#6950a1')
)],
label_opts=opts.LabelOpts(is_show=False),
),
color='#6950a1'
)
.set_series_opts(linestyle_opts=linestyle_dic, label_opts=opts.LabelOpts(font_size=12,color='#6950a1'))
.set_global_opts(
title_opts=opts.TitleOpts(
title='历届夏奥会获奖国家数量趋势',
title_textstyle_opts=opts.TextStyleOpts(font_size=20)),
xaxis_opts=opts.AxisOpts(axislabel_opts=opts.LabelOpts(font_size=14),
axisline_opts=opts.AxisLineOpts(is_show=True,
linestyle_opts=opts.LineStyleOpts(width=2))),
yaxis_opts=opts.AxisOpts(
is_scale=True,
name_textstyle_opts=opts.TextStyleOpts(
font_size=16, font_weight='bold'),
axislabel_opts=opts.LabelOpts(
font_size=13),
splitline_opts=opts.SplitLineOpts(is_show=True,
linestyle_opts=opts.LineStyleOpts(type_='dashed')),
axisline_opts=opts.AxisLineOpts(is_show=True,
linestyle_opts=opts.LineStyleOpts(width=2))
),
legend_opts=opts.LegendOpts(is_show=True, pos_right='1%', pos_top='2%',legend_icon='roundRect'),
)
)
timeline.add(line, '{}'.format(engage_data[i][0]))
timeline.render("./Visual/[时间线折线图]历届夏奥会获奖国家数量趋势.html")

6. 历届冬奥会获奖国家数量时间线折线图
#[可视化]历届冬奥会获奖国家数量趋势
from pyecharts import options as opts
from pyecharts.charts import Line,Timeline
from pyecharts.globals import ThemeType,JsCode
# 统计各国家在各年份的奖牌数量
athletes_df=pd.read_csv("./DataSet/History/athlete_events.csv")
winter_count_df=athletes_df[athletes_df['Season']=='Winter'].groupby(['Year','Team'])['Medal'].count().reset_index()
# 获取历届冬奥会获奖国家数量
medals_data=[]
years=winter_count_df['Year'].drop_duplicates()
for year in years:
medals_data.append([year,winter_count_df.loc[(winter_count_df['Year']==year)&(winter_count_df['Medal']!=0)].shape[0]])
# 线条样式
linestyle_dic = {'normal': {
'width': 4,
'color':'#6950a1',
'shadowColor': '#696969',
'shadowBlur': 10,
'shadowOffsetY': 10,
'shadowOffsetX': 10,
}
}
timeline = Timeline().add_schema(is_auto_play=True, is_loop_play=False,is_timeline_show=True, play_interval=500)
data = []
x_data = []
for year in years:
x_data.append(str(year))
for i in range(len(x_data)):
data.append(medals_data[i][-1])
line = (
Line()
.add_xaxis(x_data)
.add_yaxis(
'',
data,
symbol_size=10,
is_smooth=True,
label_opts=opts.LabelOpts(is_show=True),
markpoint_opts=opts.MarkPointOpts(
data=[opts.MarkPointItem(
name="",
type_='max',
value_index=0,
symbol_size=[40, 25],
itemstyle_opts=opts.ItemStyleOpts(color='#6950a1')
)],
label_opts=opts.LabelOpts(is_show=False),
),
color='#6950a1'
)
.set_series_opts(linestyle_opts=linestyle_dic, label_opts=opts.LabelOpts(font_size=12,color='#6950a1'))
.set_global_opts(
title_opts=opts.TitleOpts(
title='历届冬奥会获奖国家数量趋势',
title_textstyle_opts=opts.TextStyleOpts(font_size=20)),
xaxis_opts=opts.AxisOpts(axislabel_opts=opts.LabelOpts(font_size=14),
axisline_opts=opts.AxisLineOpts(is_show=True,
linestyle_opts=opts.LineStyleOpts(width=2))),
yaxis_opts=opts.AxisOpts(
is_scale=True,
name_textstyle_opts=opts.TextStyleOpts(
font_size=16, font_weight='bold'),
axislabel_opts=opts.LabelOpts(
font_size=13),
splitline_opts=opts.SplitLineOpts(is_show=True,
linestyle_opts=opts.LineStyleOpts(type_='dashed')),
axisline_opts=opts.AxisLineOpts(is_show=True,
linestyle_opts=opts.LineStyleOpts(width=2))
),
legend_opts=opts.LegendOpts(is_show=True, pos_right='1%', pos_top='2%',legend_icon='roundRect'),
)
)
timeline.add(line, '{}'.format(engage_data[i][0]))
timeline.render("./Visual/[时间线折线图]历届冬奥会获奖国家数量趋势.html")

7. 历届夏奥会或冬奥会参赛|获奖国家数量时间线折线图
将上述图表组合起来,得到下列图表:  
2.4 比例可视化
1. 历届夏奥会参赛国家获奖比例堆叠柱状折线图
#[可视化]历届夏奥会获奖|未获奖国家比例
from pyecharts import options as opts
from pyecharts.charts import Bar, Line
from pyecharts.globals import ThemeType
# 统计各国家在各年份的奖牌数量
athletes_df=pd.read_csv("./DataSet/History/athlete_events.csv")
summer_count_df=athletes_df[athletes_df['Season']=='Summer'].groupby(['Year','Team'])['Medal'].count().reset_index()
# 获取历届夏奥会参赛国家数量
others_data=[]
medals_data=[]
years=summer_count_df['Year'].drop_duplicates()
for year in years:
others_data.append(summer_count_df.loc[(summer_count_df['Year']==year)&(summer_count_df['Medal']==0)].shape[0])
medals_data.append(summer_count_df.loc[(summer_count_df['Year']==year)&(summer_count_df['Medal']!=0)].shape[0])
# 折线图数据
line_data=[]
for i in range(len(medals_data)):
line_data.append(round(medals_data[i]/(medals_data[i]+others_data[i]),2))
x_data = []
for year in years:
x_data.append(str(year))
bar = (
Bar(init_opts=opts.InitOpts(theme='light'))
.add_xaxis(x_data)
.add_yaxis("获奖",medals_data,stack=1,z_level=2)
.add_yaxis("未获奖",others_data,stack=1)
.extend_axis(
yaxis=opts.AxisOpts(
axislabel_opts=opts.LabelOpts(formatter="{value}"),
max_=1
)
)
.set_series_opts(label_opts=opts.LabelOpts(font_size=12))
.set_global_opts(
title_opts=opts.TitleOpts(
title='历届夏奥会获奖|未获奖国家分布',
title_textstyle_opts=opts.TextStyleOpts(font_size=20)),
xaxis_opts=opts.AxisOpts(axislabel_opts=opts.LabelOpts(font_size=14),
axisline_opts=opts.AxisLineOpts(is_show=True,linestyle_opts=opts.LineStyleOpts(width=2))),
yaxis_opts=opts.AxisOpts(
is_scale=True,
name_textstyle_opts=opts.TextStyleOpts(
font_size=16, font_weight='bold'),
axislabel_opts=opts.LabelOpts(
font_size=13),
splitline_opts=opts.SplitLineOpts(is_show=True,
linestyle_opts=opts.LineStyleOpts(type_='dashed')),
axisline_opts=opts.AxisLineOpts(is_show=True,
linestyle_opts=opts.LineStyleOpts(width=2))
),
legend_opts=opts.LegendOpts(is_show=True, pos_right='1%', pos_top='2%'),
datazoom_opts=opts.DataZoomOpts()
)
)
line = Line().add_xaxis(x_data).add_yaxis("占比", line_data, yaxis_index=1,z_level=100)
bar.overlap(line)
bar.render("./Visual/[堆叠柱状折线图]历届夏奥会获奖-未获奖国家比例.html")

2. 历届冬奥会参赛国家获奖比例堆叠柱状折线图
#[可视化]历届夏奥会获奖|未获奖国家比例
from pyecharts import options as opts
from pyecharts.charts import Bar, Line
from pyecharts.globals import ThemeType
# 统计各国家在各年份的奖牌数量
athletes_df=pd.read_csv("./DataSet/History/athlete_events.csv")
count_df=athletes_df[athletes_df['Season']=='Winter'].groupby(['Year','Team'])['Medal'].count().reset_index()
# 获取历届夏奥会参赛国家数量
others_data=[]
medals_data=[]
years=count_df['Year'].drop_duplicates()
for year in years:
others_data.append(count_df.loc[(count_df['Year']==year)&(count_df['Medal']==0)].shape[0])
medals_data.append(count_df.loc[(count_df['Year']==year)&(count_df['Medal']!=0)].shape[0])
# 折线图数据
line_data=[]
for i in range(len(medals_data)):
line_data.append(round(medals_data[i]/(medals_data[i]+others_data[i]),2))
x_data = []
for year in years:
x_data.append(str(year))
bar = (
Bar(init_opts=opts.InitOpts(theme='light'))
.add_xaxis(x_data)
.add_yaxis("获奖",medals_data,stack=1,z_level=2)
.add_yaxis("未获奖",others_data,stack=1)
.extend_axis(
yaxis=opts.AxisOpts(
axislabel_opts=opts.LabelOpts(formatter="{value}"),
max_=1
)
)
.set_series_opts(label_opts=opts.LabelOpts(font_size=12))
.set_global_opts(
title_opts=opts.TitleOpts(
title='历届冬奥会获奖|未获奖国家分布',
title_textstyle_opts=opts.TextStyleOpts(font_size=20)),
xaxis_opts=opts.AxisOpts(axislabel_opts=opts.LabelOpts(font_size=14),
axisline_opts=opts.AxisLineOpts(is_show=True,linestyle_opts=opts.LineStyleOpts(width=2))),
yaxis_opts=opts.AxisOpts(
is_scale=True,
name_textstyle_opts=opts.TextStyleOpts(
font_size=16, font_weight='bold'),
axislabel_opts=opts.LabelOpts(
font_size=13),
splitline_opts=opts.SplitLineOpts(is_show=True,
linestyle_opts=opts.LineStyleOpts(type_='dashed')),
axisline_opts=opts.AxisLineOpts(is_show=True,
linestyle_opts=opts.LineStyleOpts(width=2))
),
legend_opts=opts.LegendOpts(is_show=True, pos_right='1%', pos_top='2%'),
datazoom_opts=opts.DataZoomOpts()
)
)
line = Line().add_xaxis(x_data).add_yaxis("占比", line_data, yaxis_index=1,z_level=100)
bar.overlap(line)
bar.render("./Visual/[堆叠柱状折线图]历届冬奥会获奖-未获奖国家比例.html")
 至此,利用Kaggle120年奥运会数据集的数据可视化就完成啦,欢迎交流! 至此,利用Kaggle120年奥运会数据集的数据可视化就完成啦,欢迎交流!
|