|
原文链接:https://mp.weixin.qq.com/s?__biz=MzAxMDkxODM1Ng==&mid=2247486585&idx=1&sn=3035f6420904aad2c8161b362cdeb472&chksm=9b484cc2ac3fc5d479fc5bce3d68d4666b763652a21a55b281aad8c0c4df9b56b4d3b353cc4c&scene=21#wechat_redirect
1.RTCGA相关包的下载及使用?
(1)相关包的下载:(原文中的代码在我的电脑上执行的有些问题,故包的下载代码修改如下:)
if (!requireNamespace("BiocManager", quietly = TRUE)) install.packages("BiocManager") BiocManager::install("RTCGA") BiocManager::install("RTCGA.clinical") BiocManager::install("RTCGA.rnaseq") BiocManager::install("RTCGA.mRNA") BiocManager::install("RTCGA.mutations")
(2)包的使用代码为:library(包的名称)
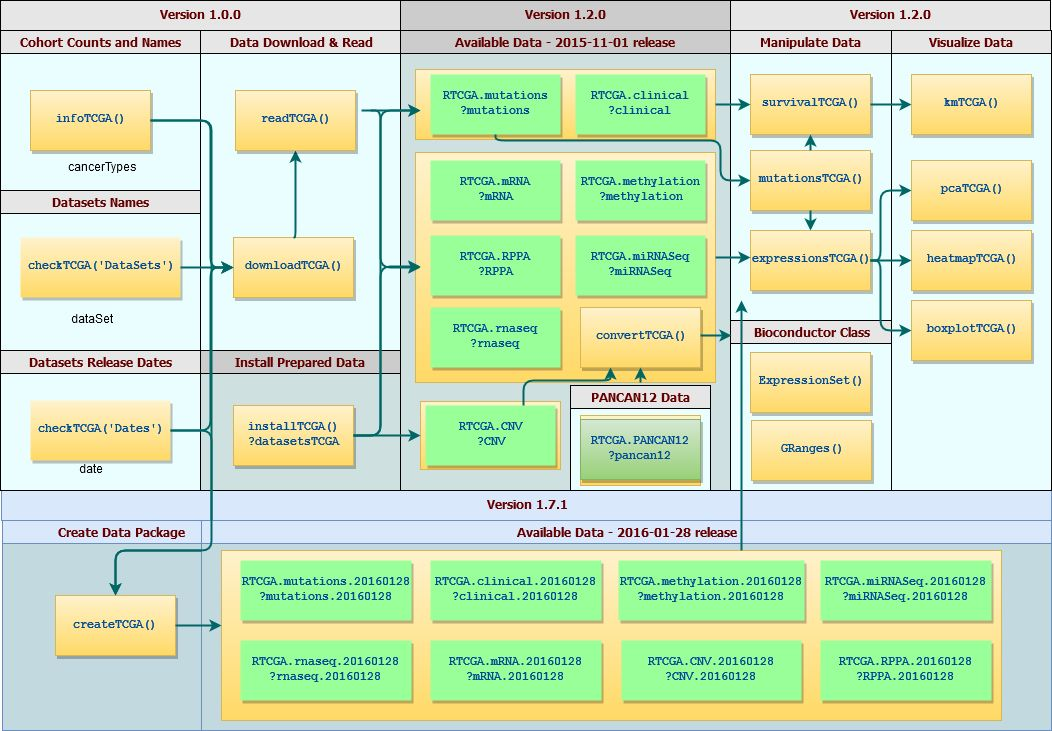
2.RTCGA包的工作流程?(图片是从原文中截取的)
3.指定任意基因从任意癌症里面获取芯片表达数据
library(RTCGA)
library(RTCGA.mRNA)
#收集TCGA数据集的表达式(表达量数据)(Gather Expressions for TCGA Datasets)
expr rnaseq.5genes.3cancers
DT::datatable(rnaseq.5genes.3cancers)
#主成分分析
#pcaTCGA(rnaseq.5genes.3cancers, "dataset") -> pca_plot
#plot(pca_plot)
8.用突变数据做生存分析
library(RTCGA.mutations)
library(dplyr)
library(survminer)
mutationsTCGA(BRCA.mutations, OV.mutations) %>%
filter(Hugo_Symbol == 'TP53') %>%
filter(substr(bcr_patient_barcode, 14, 15) ==
"01") %>% # cancer tissue
mutate(bcr_patient_barcode =
substr(bcr_patient_barcode, 1, 12)) ->
BRCA_OV.mutations
library(RTCGA.clinical)
survivalTCGA(
BRCA.clinical,
OV.clinical,
extract.cols = "admin.disease_code"
) %>%
dplyr::rename(disease = admin.disease_code) ->
BRCA_OV.clinical
BRCA_OV.clinical %>%
left_join(
BRCA_OV.mutations,
by = "bcr_patient_barcode"
) %>%
mutate(TP53 =
ifelse(!is.na(Variant_Classification), "Mut","WILDorNOINFO")) ->
BRCA_OV.clinical_mutations
BRCA_OV.clinical_mutations %>%
select(times, patient.vital_status, disease, TP53) -> BRCA_OV.2plot
kmTCGA(
BRCA_OV.2plot,
explanatory.names = c("TP53", "disease"),
break.time.by = 400,
xlim = c(0,2000),
pval = TRUE) -> km_plot
print(km_plot)
效果图如下:

9.多个基因在多种癌症的表达量热图
library(RTCGA.rnaseq)
# perfrom plot
# library(dplyr) if did not load at start
expressionsTCGA(
ACC.rnaseq,
BLCA.rnaseq,
BRCA.rnaseq,
OV.rnaseq,
extract.cols =
c("MET|4233",
"ZNF500|26048",
"ZNF501|115560")
) %>%
dplyr::rename(cohort = dataset,
MET = `MET|4233`) %>%
#cancer samples
filter(substr(bcr_patient_barcode, 14, 15) ==
"01") %>%
mutate(MET = cut(MET,
round(quantile(MET, probs = seq(0,1,0.25)), -2),
include.lowest = TRUE,
dig.lab = 5)) -> ACC_BLCA_BRCA_OV.rnaseq
ACC_BLCA_BRCA_OV.rnaseq %>%
select(-bcr_patient_barcode) %>%
group_by(cohort, MET) %>%
summarise_each(funs(median)) %>%
mutate(ZNF500 = round(`ZNF500|26048`),
ZNF501 = round(`ZNF501|115560`)) ->
ACC_BLCA_BRCA_OV.rnaseq.medians
heatmapTCGA(ACC_BLCA_BRCA_OV.rnaseq.medians,
"cohort", "MET", "ZNF500",
title = "Heatmap of ZNF500 expression")
效果图:

10.知识点总结
(1)R语言中的table函数:主要有两个作用:
1°统计每个数据出现的次数。aq: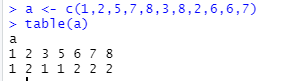
2°实现混淆矩阵。(ps:暂未理解)
(2)R语言中的gsub函数:R语言中的sub()函数和gsub()函数均为字符串替换函数,两者的区别在于sub()函数只会替换最初匹配到的字符串,且只匹配一次,而gsub()函数会替换掉所有匹配的字符串。gsub()函数的具体用法为gsub(“替换的目标字符串”,"被替换的字符串",父串)。
(3)R语言中的paste0函数:paste()函数和paste0()函数均为字符串连接函数。区别在于连接的两个字符串之间的符号是否为空。

(4)R语言的ggpubr包中的重要函数。
1°ggboxplot函数:该函数绘制的是箱型图。参数如下:
ggboxplot(data, x, y, combine = FALSE, merge = FALSE, color = "black",
fill = "white", palette = NULL, title = NULL, xlab = NULL,
ylab = NULL, facet.by = NULL, panel.labs = NULL,
short.panel.labs = TRUE, linetype = "solid", size = NULL, width = 0.7,
notch = FALSE, select = NULL, remove = NULL, order = NULL,
add = "none", add.params = list(), error.plot = "pointrange",
label = NULL, font.label = list(size = 11, color = "black"),
label.select = NULL, repel = FALSE, label.rectangle = FALSE,
ggtheme = theme_pubr(), ...)
2°ggpubr中的两个关键函数:compare_means():做统计分析;stat_compare_means():自行完成统计分析,并在图中加入显著性信息。
(5)R语言中的dplyr包:https://blog.csdn.net/wltom1985/article/details/54973811(该篇文章中的函数介绍的比较详细)
|