| 如何更改 ggplot2 中的图例位置(带有示例) | 您所在的位置:网站首页 › r语言中ggplot2中aes › 如何更改 ggplot2 中的图例位置(带有示例) |
如何更改 ggplot2 中的图例位置(带有示例)
|
如何更改 ggplot2 中的图例位置(带有示例)经过 本杰明·安德森博
7月 25, 2023
指导
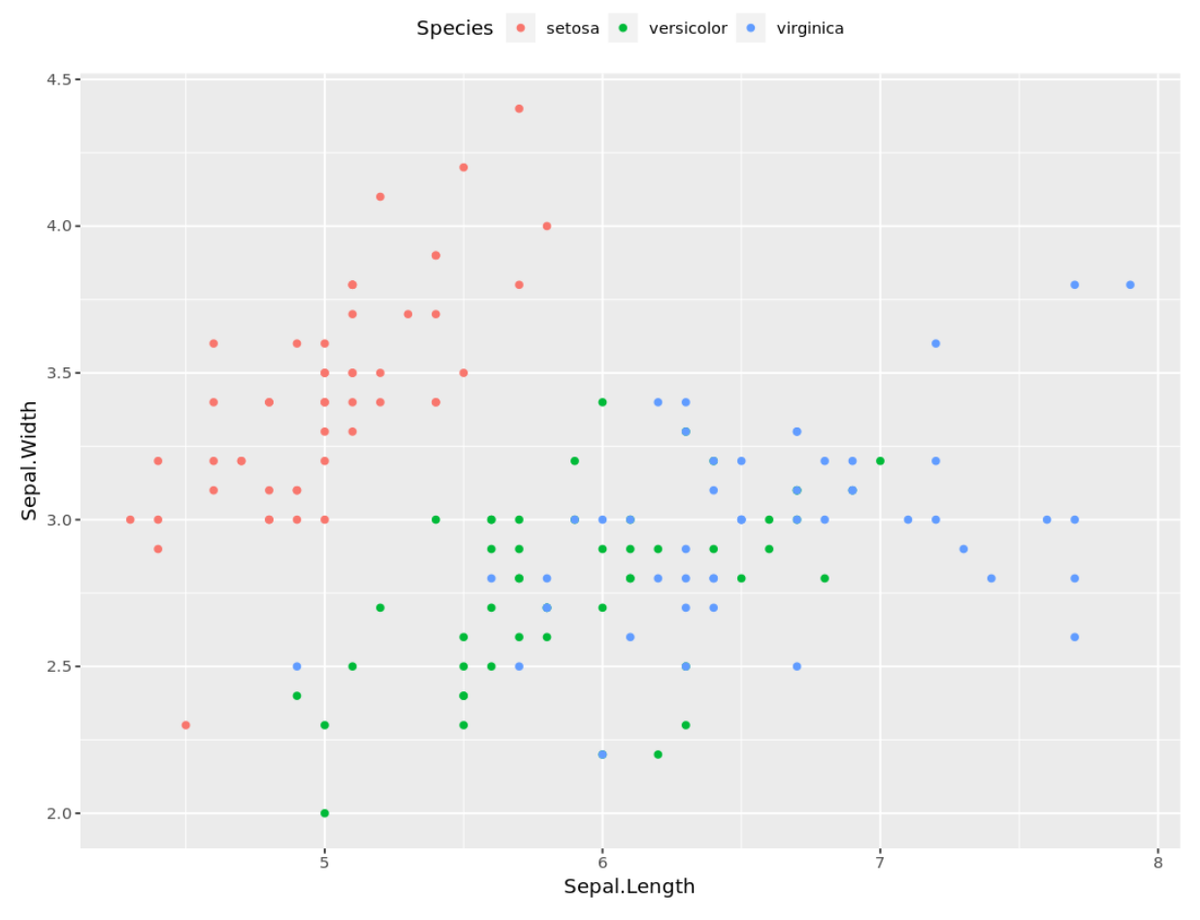
0 条评论 您可以使用以下语法来指定 ggplot2 图例的位置: theme(legend.position = " right ")以下示例展示了如何在实践中通过 R 中的内置iris数据集使用此语法。 示例:将图例放在图之外您可以直接告诉 ggplot2 将图例放置在绘图的“顶部”、“右侧”、“底部”或“左侧”。 例如,以下是将图例放置在绘图顶部的方法: library (ggplot2) ggplot(iris, aes (x=Sepal.Length, y=Sepal.Width, color=Species)) + geom_point() + theme(legend.position = “ top ”)
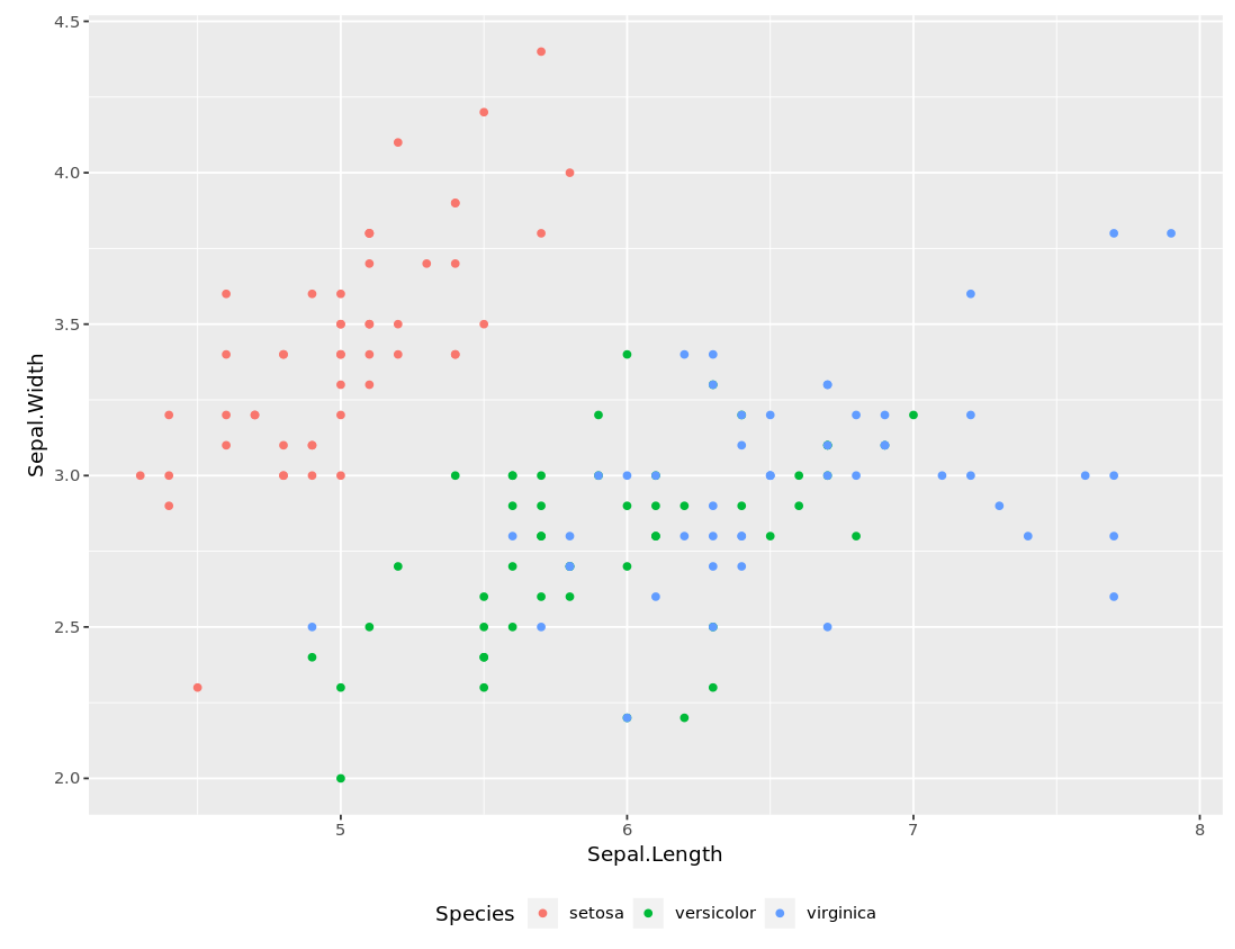
以下是将图例放置在绘图底部的方法: library (ggplot2) ggplot(iris, aes (x=Sepal.Length, y=Sepal.Width, color=Species)) + geom_point() + theme(legend.position = “ bottom ”)
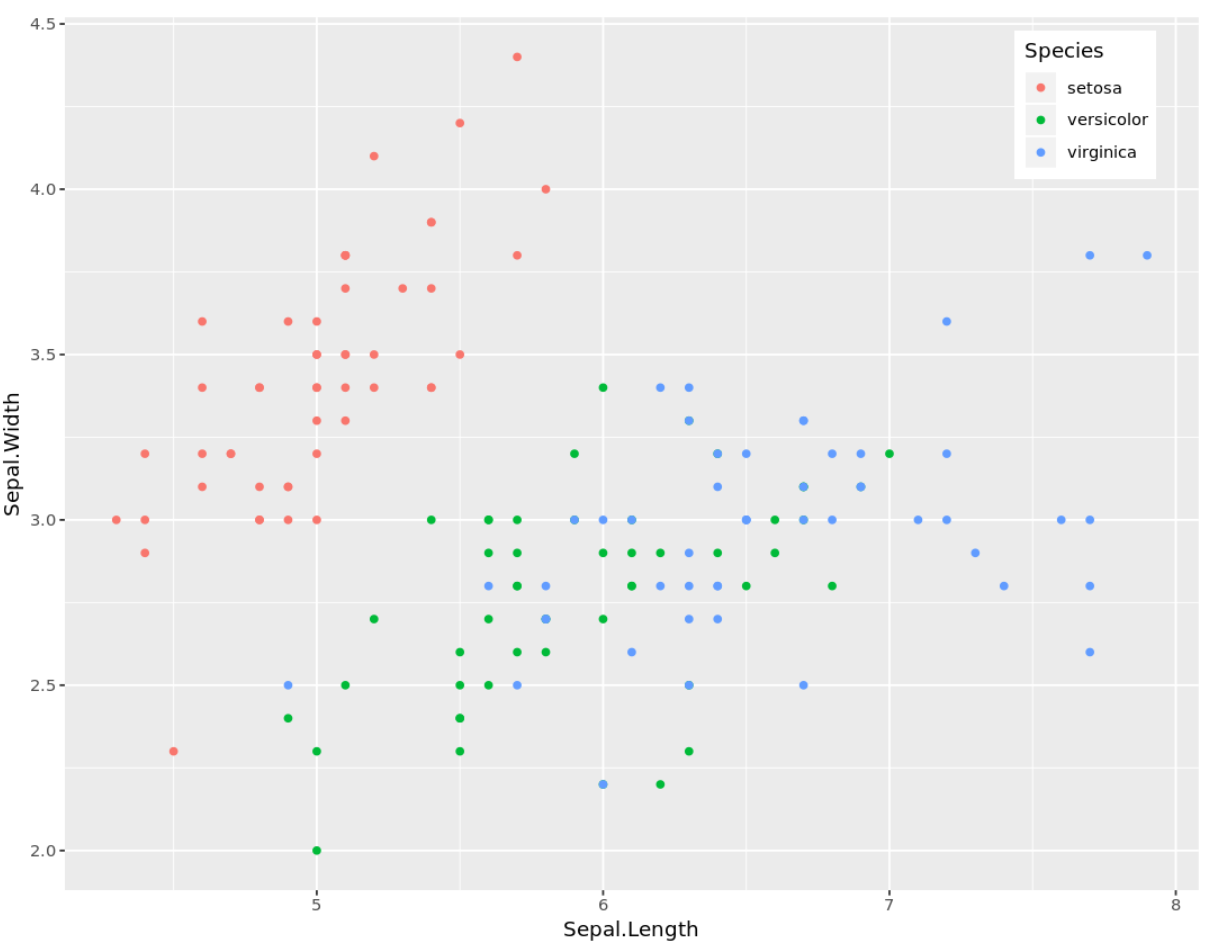
您还可以指定精确坐标 (x,y) 以将图例放置在绘图内。 例如,以下是将标题放置在右上角的方法: library (ggplot2) ggplot(iris, aes (x=Sepal.Length, y=Sepal.Width, color=Species)) + geom_point() + theme(legend.position = c( .9 , .9 ))
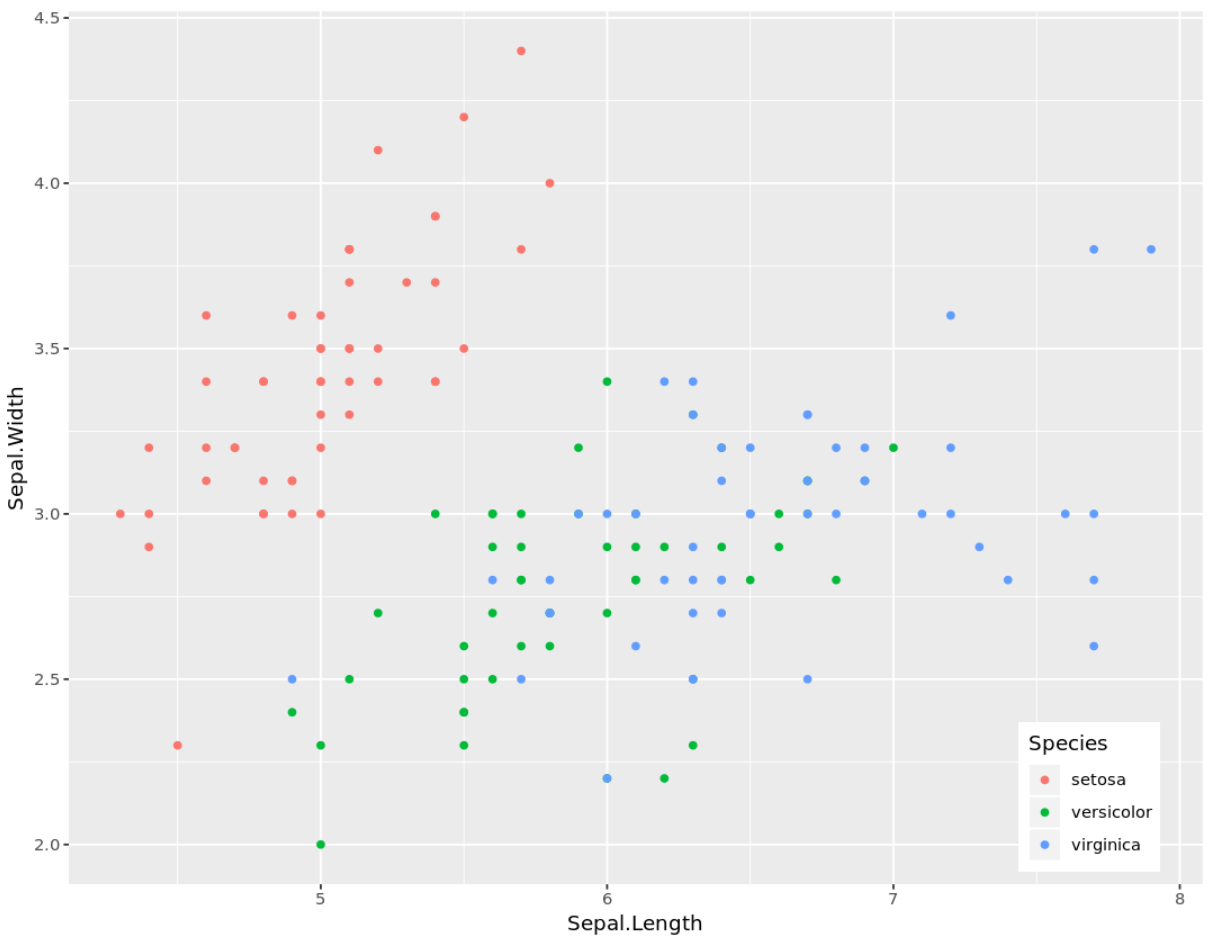
以下是将图例放置在右下角的方法: library (ggplot2) ggplot(iris, aes (x=Sepal.Length, y=Sepal.Width, color=Species)) + geom_point() + theme(legend.position = c( .9 , .1 ))
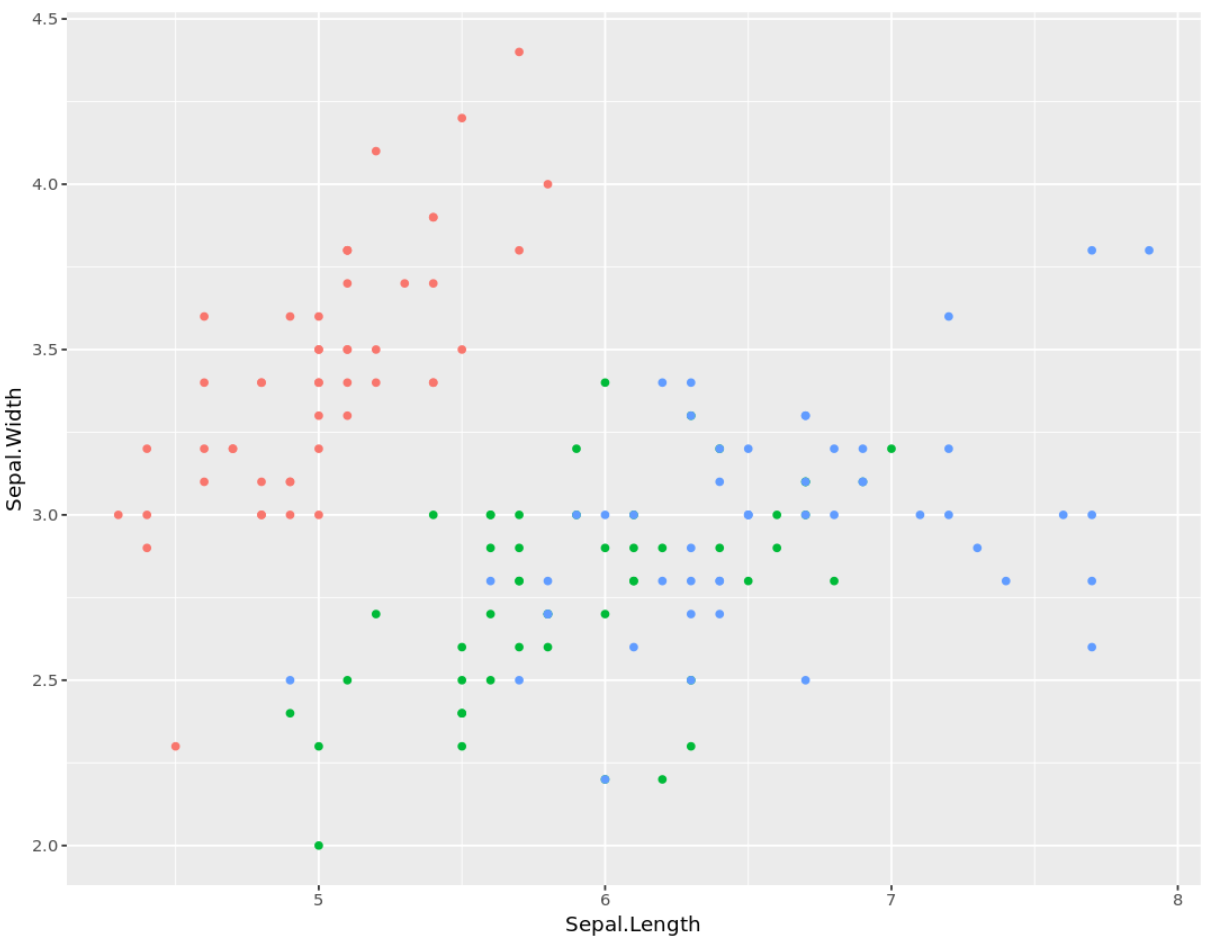
您还可以通过指定 legend.position=”none” 来完全从 ggplot2 中的图中删除图例,如下所示: library (ggplot2) ggplot(iris, aes (x=Sepal.Length, y=Sepal.Width, color=Species)) + geom_point() + theme(legend.position = " none ")
如何更改ggplot2中的图例大小如何更改ggplot2中的图例标题最佳 ggplot2 主题的完整指南 关于作者 本杰明·安德森博 本杰明·安德森博大家好,我是本杰明,一位退休的统计学教授,后来成为 Statorials 的热心教师。 凭借在统计领域的丰富经验和专业知识,我渴望分享我的知识,通过 Statorials 增强学生的能力。了解更多 添加评论取消回复 |
【本文地址】
公司简介
联系我们