|
题目来自《MATLAB程序设计与应用》第二版 刘卫国 Chapter 8 MATLAB图形用户界面设计
课后习题解答
1. 图形窗口与坐标轴
课堂讨论 在同一图形窗口建立两个坐标轴
分别用axes函数和axis函数在同一图形窗口建立两个坐标轴。例如,建立水平放置的两个坐标轴如图所示。  要求左边坐标轴用默认属性,坐标轴标题为“坐标轴1”;右边坐标轴的 x 轴范围为
[
−
π
,
π
]
[-π, π]
[−π,π],y 轴范围为
[
−
1
,
1
]
[-1, 1]
[−1,1] ,坐标轴标题为“坐标轴2”。 (1)用axes函数实现。 (2)用axis函数和subplot函数实现。 要求左边坐标轴用默认属性,坐标轴标题为“坐标轴1”;右边坐标轴的 x 轴范围为
[
−
π
,
π
]
[-π, π]
[−π,π],y 轴范围为
[
−
1
,
1
]
[-1, 1]
[−1,1] ,坐标轴标题为“坐标轴2”。 (1)用axes函数实现。 (2)用axis函数和subplot函数实现。
% (1) axes
figure(811)
ax1 = axes('Position',[0.05 0.1 0.4 0.8]);
ax1.Title.String = '坐标轴1';
ax2 = axes('Position',[0.55 0.1 0.4 0.8], ...
'XLim', [-pi, pi], 'YLim', [-1, 1]);
ax2.Title.String = '坐标轴2';
% (2) axis, subplot
figure(812)
subplot(1, 2, 1)
title('坐标轴1')
subplot(1, 2, 2)
axis([-pi, pi, -1, 1])
title('坐标轴2')
2. 曲线与曲面对象
课堂讨论1 plot函数和line函数比较
请比较用plot函数和line函数在同一坐标轴绘制多条曲线的方法。在同一坐标轴绘制
y
=
sin
x
y=\sin x
y=sinx 和
y
=
cos
x
y=\cos x
y=cosx,其中
x
∈
[
0
,
2
π
]
x∈[0, 2π]
x∈[0,2π]。要求正弦曲线用蓝色实线,余弦曲线用绿色虚线。
课堂讨论2 surf函数和surface函数比较
请比较用surf函数和surface函数在同一坐标轴绘制多个曲面的方法。在同一坐标轴绘制以下两个曲面。 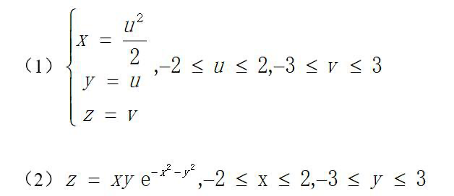
% (1) plot函数与line函数比较
x = linspace(0, 2*pi);
figure(8211)
plot(x, sin(x), 'b-', x, cos(x), 'g--')
title('plot函数')
figure(8212)
line(x', sin(x'), 'Color', 'b', 'LineStyle', '-')
line(x', cos(x'), 'Color', 'g', 'LineStyle', '--')
title('line函数')
% (2) surf函数与surface函数比较
[u, v] = meshgrid(-2:0.1:2, -3:0.1:3);
[x, y] = meshgrid(-2:0.1:2, -3:0.1:3);
figure(8221)
subplot(1, 2, 1)
surf(u.^2/2, u, v);
title('曲面(1):(u^2/2, u, v)'); xlabel('x'); ylabel('y'); zlabel('z');
subplot(1, 2, 2)
surf(x, y, x.*y.*exp(-x.^2-y.^2));
title('曲面(2):(x, y, xye^{-x^2-y^2})'); xlabel('x'); ylabel('y'); zlabel('z');
figure(8222)
subplot(1, 2, 1)
surface(u.^2/2, u, v);
title('曲面(1):(u^2/2, u, v)'); xlabel('x'); ylabel('y'); zlabel('z');
subplot(1, 2, 2)
surface(x, y, x.*y.*exp(-x.^2-y.^2));
title('曲面(2):(x, y, xye^{-x^2-y^2})'); xlabel('x'); ylabel('y'); zlabel('z');
3. 图形用户界面设计方法
课堂讨论 分析执行结果
建立如图所示的图形窗口。  若在“绘图1”按钮的回调函数体中添加以下代码: 若在“绘图1”按钮的回调函数体中添加以下代码:
x=0:pi/50:2*pi;
plot(x, sin(x),'r')
hd=line(x, cos(x));
hd.Color='b';
在“绘图2”按钮的回调函数体中添加以下代码:
x=0:pi/50:2*pi;
hd=line(x, cos(x));
hd.Color='b';
plot(x, sin(x),'r')
运行该图形窗口,分别单击这两个按钮,绘出的图形是否一样?分别是什么曲线?
S.f = figure(83);
S.ax = axes('Position',[0.2 0.25 0.6 0.6]);
S.bl = uicontrol('style','push',...
'units','normalized',...
'position',[0.25 0.05 0.2 0.1],...
'fontsize',14,...
'string','绘图1',...
'callback',{@bl_call,S});
S.br = uicontrol('style','push',...
'units','normalized',...
'Position',[0.55 0.05 0.2 0.1],...
'fontsize',14,...
'string','绘图2',...
'callback',{@br_call,S});
function bl_call(varargin)
S = varargin{3}; % Get the structure.
S.ax();
x = 0 : pi/50 : 2*pi;
plot(x, sin(x),'r');
hd = line(x, cos(x));
hd.Color='b';
end
function br_call(varargin)
S = varargin{3}; % Get the structure.
S.ax();
x = 0 : pi/50 : 2*pi;
hd = line(x, cos(x));
hd.Color='b';
plot(x, sin(x),'r');
end
4. 用户界面设计工具
课堂讨论 建立图形用户界面的方法
分别用命令和用GUIDE工具建立一个图形用户界面。界面中包含一个坐标轴和一个“绘图”按钮,按钮的Tag属性为BtPlot。运行该用户界面,单击“绘图”按钮,在坐标轴绘制正弦曲线。比较两种方式的回调函数的定义方法。
% (1) 命令工具
S.f = figure;
S.ax = axes('Position',[0.15 0.25 0.7 0.7]);
S.btplot = uicontrol('style','push',...
'units','normalized',...
'tag', 'BtPlot',...
'position',[0.4 0.05 0.2 0.1],...
'fontsize',14,...
'string','绘图',...
'callback',{@BtPlot_call,S});
% (2) GUIDE 工具
gui_plot;

function varargout = gui_plot(varargin)
gui_Singleton = 1;
gui_State = struct('gui_Name', mfilename, ...
'gui_Singleton', gui_Singleton, ...
'gui_OpeningFcn', @gui_plot_OpeningFcn, ...
'gui_OutputFcn', @gui_plot_OutputFcn, ...
'gui_LayoutFcn', [] , ...
'gui_Callback', []);
if nargin && ischar(varargin{1})
gui_State.gui_Callback = str2func(varargin{1});
end
if nargout
[varargout{1:nargout}] = gui_mainfcn(gui_State, varargin{:});
else
gui_mainfcn(gui_State, varargin{:});
end
function gui_plot_OpeningFcn(hObject, eventdata, handles, varargin)
handles.output = hObject;
guidata(hObject, handles);
function varargout = gui_plot_OutputFcn(hObject, eventdata, handles)
varargout{1} = handles.output;
function BtPlot_Callback(hObject, eventdata, handles)
axes(handles.axes1);
cla;
x = 0 : pi/50 : 2*pi;
plot(x, sin(x),'r');
function axes1_CreateFcn(hObject, eventdata, handles)
function axes1_DeleteFcn(hObject, eventdata, handles)
5. APP设计工具
课堂讨论 APP设计
用App Designer工具建立一个图形用户界面,其中包含一个坐标轴、一个旋钮、一个离散旋钮和一个“绘图”按钮,旋钮的值域为
[
0
,
5
]
[0, 5]
[0,5],离散旋钮的值域为
[
1
,
4
]
[1, 4]
[1,4]。运行该用户界面,单击“绘图”按钮,从旋钮获取
m
m
m 的值,从离散旋钮获取
n
n
n 的值,在坐标轴绘制曲线,以下是曲线方程: 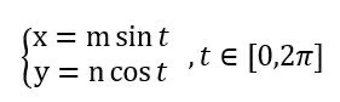
app85;

classdef app85 < matlab.apps.AppBase
% Properties that correspond to app components
properties (Access = public)
UIFigure matlab.ui.Figure
UIAxes matlab.ui.control.UIAxes
Knob matlab.ui.control.Knob
Knob_2 matlab.ui.control.DiscreteKnob
Button matlab.ui.control.Button
end
% Callbacks that handle component events
methods (Access = private)
% Button pushed function: Button
function ButtonPushed(app, event)
m = app.Knob.Value;
n = app.Knob_2.Value;
t = linspace(0, 2*pi, 100);
plot(app.UIAxes, m*sin(t), n*cos(t));
end
end
% Component initialization
methods (Access = private)
% Create UIFigure and components
function createComponents(app)
% Create UIFigure and hide until all components are created
app.UIFigure = uifigure('Visible', 'off');
app.UIFigure.Position = [100 100 550 301];
app.UIFigure.Name = 'UI Figure';
% Create UIAxes
app.UIAxes = uiaxes(app.UIFigure);
title(app.UIAxes, {'x = m sin(t)'; 'y = n cos(t) '; 't \in [0 2\pi]'})
xlabel(app.UIAxes, 'X')
ylabel(app.UIAxes, 'Y')
app.UIAxes.TitleFontWeight = 'bold';
app.UIAxes.Position = [137 12 400 275];
% Create Knob
app.Knob = uiknob(app.UIFigure, 'continuous');
app.Knob.Limits = [0 5];
app.Knob.Position = [47 199 60 60];
app.Knob.Value = 2.5;
% Create Knob_2
app.Knob_2 = uiknob(app.UIFigure, 'discrete');
app.Knob_2.Items = {'1', '2', '3', '4'};
app.Knob_2.Position = [47 99 60 60];
app.Knob_2.Value = '2';
% Create Button
app.Button = uibutton(app.UIFigure, 'push');
app.Button.ButtonPushedFcn = createCallbackFcn(app, @ButtonPushed, true);
app.Button.FontSize = 18;
app.Button.Position = [27 40 100 40];
app.Button.Text = '绘图';
% Show the figure after all components are created
app.UIFigure.Visible = 'on';
end
end
% App creation and deletion
methods (Access = public)
% Construct app
function app = app85
% Create UIFigure and components
createComponents(app)
% Register the app with App Designer
registerApp(app, app.UIFigure)
if nargout == 0
clear app
end
end
% Code that executes before app deletion
function delete(app)
% Delete UIFigure when app is deleted
delete(app.UIFigure)
end
end
end
6. 图形用户界面应用举例
课堂讨论 GUIDE和App Designer工具的应用
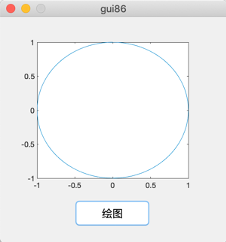
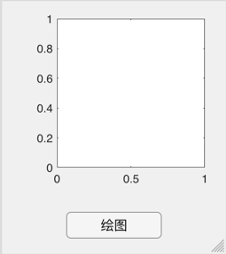
分别用GUIDE和App Designer工具建立一个图形用户界面。界面中包含一个坐标轴和一个“绘图”按钮,按钮的Tag属性为BtPlot。运行该用户界面,单击“绘图”按钮,在坐标轴用plot函数绘制一个圆。比较两种方法的回调函数的定义方法以及plot函数的调用方法。
% (1) GUIDE
gui86;
function varargout = gui86(varargin)
gui_Singleton = 0;
gui_State = struct('gui_Name', mfilename, ...
'gui_Singleton', gui_Singleton, ...
'gui_OpeningFcn', @gui86_OpeningFcn, ...
'gui_OutputFcn', @gui86_OutputFcn, ...
'gui_LayoutFcn', [] , ...
'gui_Callback', []);
if nargin && ischar(varargin{1})
gui_State.gui_Callback = str2func(varargin{1});
end
if nargout
[varargout{1:nargout}] = gui_mainfcn(gui_State, varargin{:});
else
gui_mainfcn(gui_State, varargin{:});
end
function gui86_OpeningFcn(hObject, eventdata, handles, varargin)
handles.output = hObject;
guidata(hObject, handles);
function varargout = gui86_OutputFcn(hObject, eventdata, handles)
varargout{1} = handles.output;
function BtPlot_Callback(hObject, eventdata, handles)
axes(handles.axes1);
cla;
t = 0 : pi/50 : 2*pi;
plot(sin(t), cos(t));
% (2) App Designer
app86;
classdef app86 < matlab.apps.AppBase
% Properties that correspond to app components
properties (Access = public)
UIFigure matlab.ui.Figure
UIAxes matlab.ui.control.UIAxes
BtPlot matlab.ui.control.Button
end
% Callbacks that handle component events
methods (Access = private)
% Button pushed function: BtPlot
function BtPlotPushed(app, event)
t = 0 : pi/50 : 2*pi;
plot(app.UIAxes, sin(t), cos(t));
end
end
% Component initialization
methods (Access = private)
% Create UIFigure and components
function createComponents(app)
% Create UIFigure and hide until all components are created
app.UIFigure = uifigure('Visible', 'off');
app.UIFigure.Position = [100 100 234 265];
app.UIFigure.Name = 'UI Figure';
% Create UIAxes
app.UIAxes = uiaxes(app.UIFigure);
title(app.UIAxes, '')
xlabel(app.UIAxes, '')
ylabel(app.UIAxes, '')
app.UIAxes.Box = 'on';
app.UIAxes.TitleFontWeight = 'bold';
app.UIAxes.Position = [18 55 200 200];
% Create BtPlot
app.BtPlot = uibutton(app.UIFigure, 'push');
app.BtPlot.ButtonPushedFcn = createCallbackFcn(app, @BtPlotPushed, true);
app.BtPlot.FontSize = 14;
app.BtPlot.Position = [68 17 100 28];
app.BtPlot.Text = '绘图';
% Show the figure after all components are created
app.UIFigure.Visible = 'on';
end
end
% App creation and deletion
methods (Access = public)
% Construct app
function app = app86
% Create UIFigure and components
createComponents(app)
% Register the app with App Designer
registerApp(app, app.UIFigure)
if nargout == 0
clear app
end
end
% Code that executes before app deletion
function delete(app)
% Delete UIFigure when app is deleted
delete(app.UIFigure)
end
end
end
感谢 CSDN 用户 大胖子zi 提供的习题内容。
|