| 使用matlab GUI编写坐标正反算程序 | 您所在的位置:网站首页 › matlabstr2double函数 › 使用matlab GUI编写坐标正反算程序 |
使用matlab GUI编写坐标正反算程序
|
在学习MATLAB测量程序设计这门课中,编写了一个用于测量学中坐标正反算的GUI界面,记录如下 一、设计界面首先,启动GUIDE:在命令行中键入GUIDE命令启动GUIDE,弹出下面窗口: 
选择BlankGUI,确定,会创建一个设计GUI 界面的窗口: 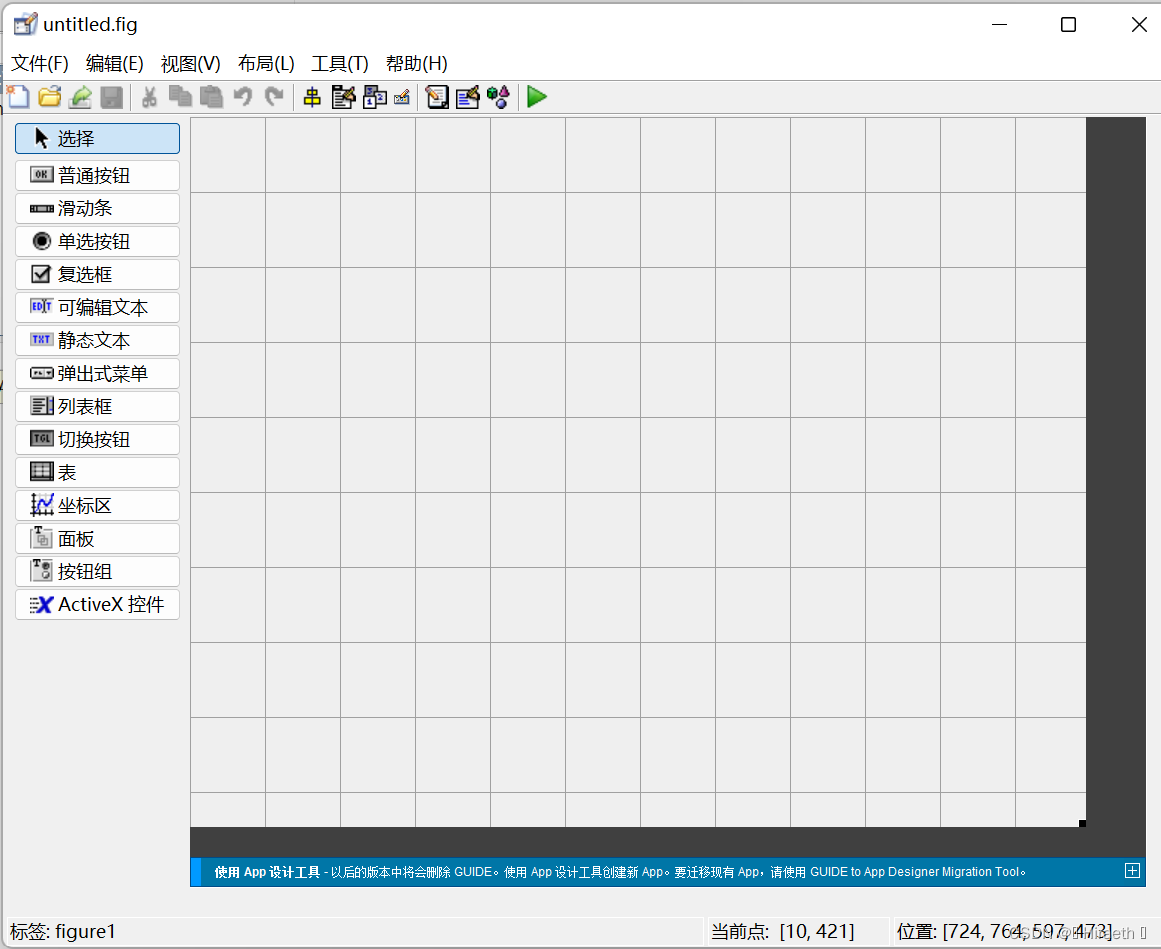
在该窗口中可以通过控件的拖拽对界面进行设计和布局,本文主要记录控件功能的编写,对GUI界面的设计具体使用方法在此不再阐述。 设计好的界面命名为poeitive_negative_Coordinates.fig,如下图所示: 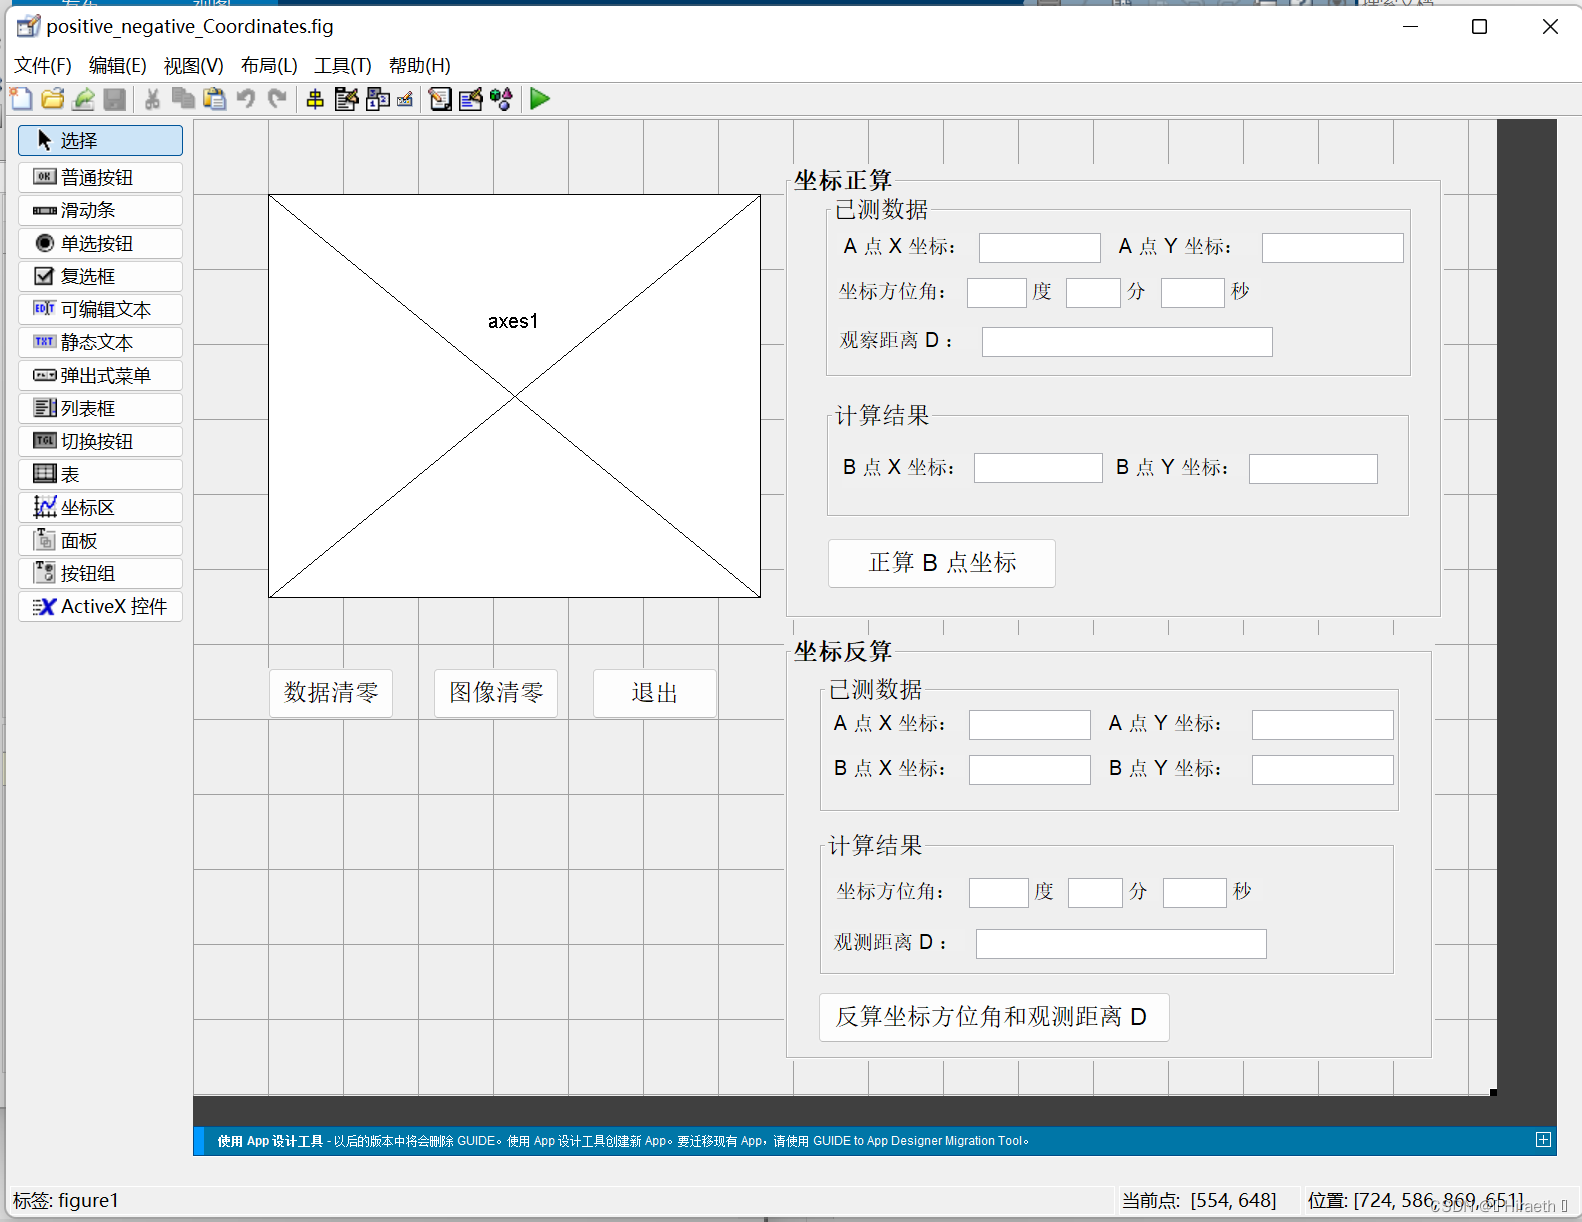
设计好的界面会自动生成一个.m文件用来编写程序实现相应控件的功能,本文在对应的poeitive_negative_Coordinates.m文件中对控件功能进行实现 二、功能实现 图像清零按钮: function pushbutton1_Callback(hObject, eventdata, handles) % hObject handle to pushbutton1 (see GCBO) % eventdata reserved - to be defined in a future version of MATLAB % handles structure with handles and user data (see GUIDATA) axes(handles.axes1); %指定需要清空的坐标轴 cla reset; 数据清零按钮: function pushbutton7_Callback(hObject, eventdata, handles) % hObject handle to pushbutton7 (see GCBO) % eventdata reserved - to be defined in a future version of MATLAB % handles structure with handles and user data (see GUIDATA) set(findobj('style','edit'),'string','')%清空edit文本数据 界面退出按钮: function pushbutton2_Callback(hObject, eventdata, handles) % hObject handle to pushbutton2 (see GCBO) % eventdata reserved - to be defined in a future version of MATLAB % handles structure with handles and user data (see GUIDATA) close 坐标正算组合功能: function pushbutton3_Callback(hObject, eventdata, handles) % hObject handle to pushbutton3 (see GCBO) % eventdata reserved - to be defined in a future version of MATLAB % handles structure with handles and user data (see GUIDATA) % 坐标正算: ya = str2num(get(handles.edit2,'string')); % 读取已测点竖坐标 xa = str2num(get(handles.edit1,'string')); % 读取已测点横坐标 D = str2num(get(handles.edit6,'string')); % 读取两点间距离 du = str2num(get(handles.edit3,'string')); % 读取方位角度数 fen = str2num(get(handles.edit4,'string')); % 读取方位角分数 miao = str2num(get(handles.edit5,'string')); % 读取方位角秒数 a = du + fen/60 + miao/3600; % 计算方位角 yb = ya + D * cos(pi * a/180);% 计算未知点竖坐标 xb = xa + D * sin(pi * a/180);% 计算未知点横坐标 set(handles.edit8,'string',num2str(yb)); %在界面上显示待测点竖坐标 set(handles.edit7,'string', num2str(xb)); % 在界面上显示待测点横坐标 % 绘制图像 % axes(handles,axes1); % 打开坐标轴 plot(xa,ya,'ro',xb,yb,'ro','MarkerSize',12); % 画已测点和待测点 hold on; % 保持图像 plot ([xa,xb],[ya,yb], 'k','LineWidth',2); grid on; text(xa,ya,'A 点','Fontsize',16);text(xb,yb,'B 点','Fontsize',16); % 画直线段与标注点 plot([xa,xa], [ya,yb], 'b-.');plot([xa,xb],[yb,yb],'b-.'); % 画两虚线段 x0 = max(xa,xb); y0 = max(ya,yb); x2 = min(xa,xb); y2 = min(ya,yb); axis([x2-0.1*x2,x0+0.1*x0,y2-0.1*y2,y0+0.1*y0]); axis('equal');% 确定坐标轴范围 xlabel('Y 轴');ylabel('X 轴'); % 标注横竖坐标轴 hold off; % 关闭图像 坐标反算组合功能: 实现此功能时注意方位角和象限角的转换 注意弧度制和角度值 function pushbutton6_Callback(hObject, eventdata, handles) % hObject handle to pushbutton6 (see GCBO) % eventdata reserved - to be defined in a future version of MATLAB % handles structure with handles and user data (see GUIDATA) % 计算距离 D2 ya2 = str2num(get(handles.edit10,'string')); xa2 = str2num(get(handles.edit9,'string')); yb2 = str2num(get(handles.edit12,'string')); xb2 = str2num(get(handles.edit11,'string')); xab = xb2 - xa2;yab = yb2-ya2; D2 = num2str(sqrt(yab^2+xab^2)); set(handles.edit16,'string',num2str(D2)); % 绘制图像 % axes(handles,axes1); % 打开坐标轴 plot(xa2,ya2,'ro',xb2,yb2,'ro','MarkerSize',12); % 画已测点和待测点 hold on; % 保持图像 plot ([xa2,xb2],[ya2,yb2], 'k','LineWidth',2); grid on; text(xa2,ya2,'A 点','Fontsize',16);text(xb2,yb2,'B 点','Fontsize',16); % 画直线段与标注点 plot([xa2,xa2], [ya2,yb2], 'b-.');plot([xa2,xb2],[yb2,yb2],'b-.'); % 画两虚线段 x02 = max(xa2,xb2); y02 = max(ya2,yb2); x22 = min(xa2,xb2); y22 = min(ya2,yb2); axis([x22-0.1*x22,x02+0.1*x02,y22-0.1*y22,y02+0.1*y02]); axis('equal');% 确定坐标轴范围 xlabel('Y 轴');ylabel('X 轴'); % 标注横竖坐标轴 hold off; % 关闭图像 % 计算方位角 fwj = atan(yab/xab); fwj = rad2deg(fwj); if xab>0&yab>0 fwj = fwj; elseif xab>0&yab |
【本文地址】
公司简介
联系我们