| Echarts雷达图自定义设置(2) | 您所在的位置:网站首页 › echart图例与自定义div联动 › Echarts雷达图自定义设置(2) |
Echarts雷达图自定义设置(2)
|
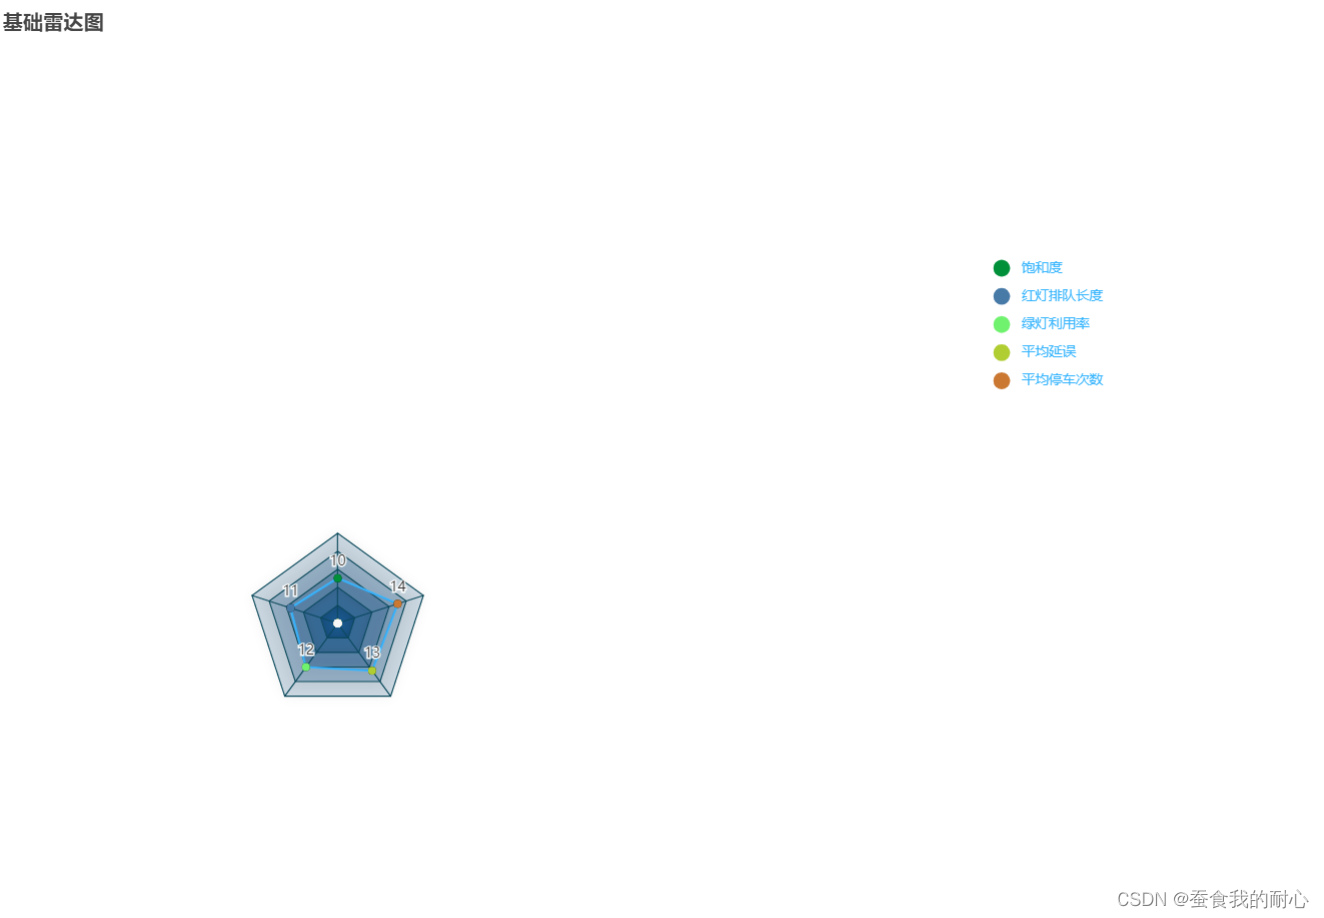
1.首先这是关于雷达图自定义设置的下一篇,包含了一些雷达图常用的配置;关于上一篇文章的地址在下面: Echarts雷达图自定义设置_蚕食我的耐心的博客-CSDN博客 2.以下代码要配合数据, 其他的不多说直接上配置 var labelArr = [ '饱和度', '红灯排队长度', '绿灯利用率', '平均延误', '平均停车次数' ]; //显示图例用 let n1 = [10, '', '', '', '', ''] let n2 = ['', 11, '', '', '', ''] let n3 = ['', '',12, '', '', ''] let n4 = ['', '', '', 13, '', ''] let n5 = ['', '', '', '', 14, ''] let n6 = ['', '', '', '', '', ''] option = { title: { text: "基础雷达图" }, tooltip: {}, legend: { orient: 'vertical', right: '25%', top: '20%', icon: 'pin', data: labelArr, textStyle: { color: `#1cb6ff`, } }, grid: { }, radar: [ { splitLine: { lineStyle: { color: '#000' } } }, { indicator: [ //绘制总的图形 { text: '', max: 20 }, { text: '', max: 20 }, { text: '', max: 20 }, { text: '', max: 20 }, { text: '', max: 20 } ], nameGap: 6, center: ['23%', '50%'], radius: 80, name: { textStyle: { color: '#000', fontSize: 14, fontWeight: 400 } }, splitArea: { //设置渐变背景色 areaStyle: { color: [ 'rgba(11,89,140,1)', 'rgba(11,89,140,0.8)', 'rgba(11,89,140,0.6)', 'rgba(11,89,140,0.4)', 'rgba(11,89,140,0.2)' ], shadowColor: 'rgba(0,0,0,0.3)', shadowBlur: 10 } }, axisLine: { lineStyle: { color: '#014657' } }, splitLine: { lineStyle: { color: '#014657' //网格的颜色 } } } ], series: [ { type: 'radar', //绘制总的图形不设置拐点 radarIndex: 1, data: [ { value:[10,11,12,13,14], symbolSize: 7, lineStyle: { width: 2, color: '#29B8FF', }, areaStyle: { normal: { opacity: 0.75, color: '', }, }, }, ], itemStyle: { normal: { borderWidth: 0, color: '#000', show: false, }, }, silent: true, z: 1, //图层是一层一层叠加,所以这个也是一级一级递增 }, { type: 'radar', //绘制第一个点 radarIndex: 1, name: labelArr[0], silent: true, label: { // 显示每个拐点数值 normal: { show: true, formatter: function(params) { return params.value; }, }, }, z: 2, //图层是一层一层叠加,所以这个也是一级一级递增 data: [ { value: n1, symbolSize: 7, }, ], itemStyle: { normal: { borderWidth: 2, color: '#108f3a', }, }, lineStyle: { width: 0, labelLine: { show: false, //隐藏标示线 }, }, }, { type: 'radar', radarIndex: 1, //绘制第二个点 name: labelArr[1], silent: true, label: { // 显示每个拐点数值 normal: { show: true, formatter: function(params) { return params.value; }, }, }, z: 3, //图层是一层一层叠加,所以这个也是一级一级递增 data: [ { value: n2, symbolSize: 7, }, ], itemStyle: { normal: { borderWidth: 2, color: '#437ba8', }, }, lineStyle: { width: 0, labelLine: { show: false, //隐藏标示线 }, }, }, { type: 'radar', //绘制第三个点 radarIndex: 1, name: labelArr[2], silent: true, label: { // 显示每个拐点数值 normal: { show: true, formatter: function(params) { return params.value; }, }, }, z: 4, //图层是一层一层叠加,所以这个也是一级一级递增 data: [ { value: n3, symbolSize: 7, }, ], itemStyle: { normal: { borderWidth: 2, color: '#7AF16F', }, }, lineStyle: { width: 0, labelLine: { show: false, //隐藏标示线 }, }, }, { type: 'radar', //绘制第四个点 radarIndex: 1, name: labelArr[3], silent: true, label: { // 显示每个拐点数值 normal: { show: true, formatter: function(params) { return params.value; }, }, }, z: 5, //图层是一层一层叠加,所以这个也是一级一级递增 data: [ { value: n4, symbolSize: 7, }, ], itemStyle: { normal: { borderWidth: 2, color: '#b4cc2f', }, }, lineStyle: { width: 0, labelLine: { show: false, //隐藏标示线 }, }, }, { type: 'radar', //绘制第五个点 radarIndex: 1, name: labelArr[4], silent: true, label: { // 显示每个拐点数值 normal: { show: true, formatter: function(params) { return `${params.value}`; }, }, }, z: 6, //图层是一层一层叠加,所以这个也是一级一级递增 data: [ { value:n5, symbolSize: 7, }, ], itemStyle: { normal: { borderWidth: 2, color: '#cc762f', }, }, lineStyle: { width: 0, labelLine: { show: false, //隐藏标示线 }, }, }, { type: 'radar', //这个图层是为了盖住圆心,如果去掉,圆心的颜色为最后一个图层的颜色(不信就自己试试) radarIndex: 1, name: '', silent: true, label: { // 显示每个拐点数值 normal: { show: false, }, }, z: 8, //图层是一层一层叠加,所以这个也是一级一级递增 data: [ { value: n6, symbolSize: 7, }, ], itemStyle: { normal: { borderWidth: 2, color: '#f8f7f7', }, }, lineStyle: { width: 0, labelLine: { show: false, //隐藏标示线 }, }, }, ] }上面这部分代码可以直接放到echarts官网中显示,如图:
3.这部分配置写法,解决了我无法设置内部文字和拐点颜色的弊端,当然看过我上一篇文章的小伙伴,有比较好的想法可以留言给我,一起共同探讨,不定时回复,谢谢大家! |
【本文地址】
公司简介
联系我们