| ECharts富文本标签样式 | 您所在的位置:网站首页 › echarts标签怎么换行 › ECharts富文本标签样式 |
ECharts富文本标签样式
|
文本样式相关的配置项
echarts 提供了丰富的文本标签配置项,包括: 字体基本样式设置:fontStyle、fontWeight、fontSize、fontFamily。 文字颜色:color。文字描边:textBorderColor、textBorderWidth。文字阴影:textShadowColor、textShadowBlur、textShadowOffsetX、textShadowOffsetY。文本块或文本片段大小:lineHeight、width、height、padding。文本块或文本片段的对齐:align、verticalAlign。文本块或文本片段的边框、背景(颜色或图片):backgroundColor、borderColor、borderWidth、borderRadius。文本块或文本片段的阴影:shadowColor、shadowBlur、shadowOffsetX、shadowOffsetY。文本块的位置和旋转:position、distance、rotate。可以在各处的 rich 属性中定义文本片段样式。例如 series-bar.label.rich 例如: label: { // 在文本中,可以对部分文本采用 rich 中定义样式。 // 这里需要在文本中使用标记符号: // `{styleName|text content text content}` 标记样式名。 // 注意,换行仍是使用 '\n'。 formatter: [ '{a|这段文本采用样式a}', '{b|这段文本采用样式b}这段用默认样式{x|这段用样式x}' ].join('\n'), // 这里是文本块的样式设置: color: '#333', fontSize: 5, fontFamily: 'Arial', borderWidth: 3, backgroundColor: '#984455', padding: [3, 10, 10, 5], lineHeight: 20, // rich 里是文本片段的样式设置: rich: { a: { color: 'red', lineHeight: 10 }, b: { backgroundColor: { image: 'xxx/xxx.jpg' }, height: 40 }, x: { fontSize: 18, fontFamily: 'Microsoft YaHei', borderColor: '#449933', borderRadius: 4 }, ... } }注意:如果不定义 rich,不能指定文字块的 width 和 height。 文本、文本框、文本片段的基本样式和装饰 每个文本可以设置基本的字体样式:fontStyle、fontWeight、fontSize、fontFamily。可以设置文字的颜色 color 和边框的颜色 textBorderColor、textBorderWidth。文本框可以设置边框和背景的样式:borderColor、borderWidth、backgroundColor、padding。文本片段也可以设置边框和背景的样式:borderColor、borderWidth、backgroundColor、padding。例如: 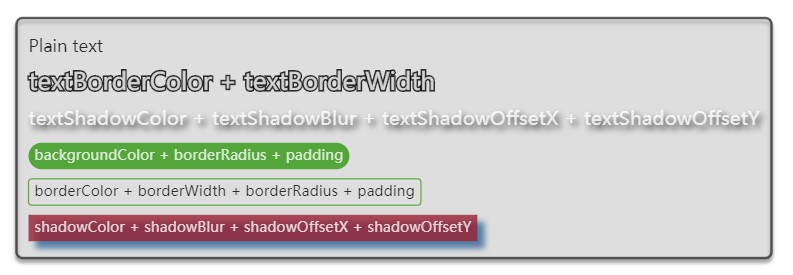
代码: ECharts // 基于准备好的dom,初始化echarts实例 var myChart = echarts.init(document.getElementById('main')); // 指定图表的配置项和数据 var option = { series: [ { type: 'scatter', symbolSize: 1, data: [{ value: [0, 0], label: { normal: { show: true, formatter: [ 'Plain text', '{textBorder|textBorderColor + textBorderWidth}', '{textShadow|textShadowColor + textShadowBlur + textShadowOffsetX + textShadowOffsetY}', '{bg|backgroundColor + borderRadius + padding}', '{border|borderColor + borderWidth + borderRadius + padding}', '{shadow|shadowColor + shadowBlur + shadowOffsetX + shadowOffsetY}' ].join('\n'), backgroundColor: '#eee', borderColor: '#333', borderWidth: 2, borderRadius: 5, padding: 10, color: '#000', fontSize: 14, shadowBlur: 3, shadowColor: '#888', shadowOffsetX: 0, shadowOffsetY: 3, lineHeight: 30, rich: { textBorder: { fontSize: 20, textBorderColor: '#000', textBorderWidth: 3, color: '#fff' }, textShadow: { fontSize: 16, textShadowBlur: 5, textShadowColor: '#000', textShadowOffsetX: 3, textShadowOffsetY: 3, color: '#fff' }, bg: { backgroundColor: '#339911', color: '#fff', borderRadius: 15, padding: 5 }, border: { color: '#000', borderColor: '#449911', borderWidth: 1, borderRadius: 3, padding: 5 }, shadow: { backgroundColor: '#992233', padding: 5, color: '#fff', shadowBlur: 5, shadowColor: '#336699', shadowOffsetX: 6, shadowOffsetY: 6 } } } } }] } ], xAxis: { axisLabel: {show: false}, axisLine: {show: false}, splitLine: {show: false}, axisTick: {show: false}, min: -1, max: 1 }, yAxis: { axisLabel: {show: false}, axisLine: {show: false}, splitLine: {show: false}, axisTick: {show: false}, min: -1, max: 1 } }; // 使用刚指定的配置项和数据显示图表。 myChart.setOption(option); 文本片段的排版和对齐 关于排版方式,每个文本片段,可以想象成 CSS 中的 inline-block,在文档流中按行放置。每个文本片段的内容盒尺寸(content box size),默认是根据文字大小决定的。但是,也可以设置 width、height 来强制指定,虽然一般不会这么做(参见下文)。文本片段的边框盒尺寸(border box size),由上述本身尺寸,加上文本片段的 padding 来得到。只有 ‘\n’ 是换行符,能导致换行。一行内,会有多个文本片段。每行的实际高度,由 lineHeight 最大的文本片段决定。文本片段的 lineHeight 可直接在 rich 中指定,也可以在 rich 的父层级中统一指定而采用到 rich 的所有项中,如果都不指定,则取文本片段的边框盒尺寸(border box size)。在一行的 lineHeight 被决定后,一行内,文本片段的竖直位置,由文本片段的 verticalAlign 来指定(这里和 CSS 中的规则稍有不同): ‘bottom’:文本片段的盒的底边贴住行底。‘top’:文本片段的盒的顶边贴住行顶。‘middle’:居行中。文本块的宽度,可以直接由文本块的 width 指定,否则,由最长的行决定。宽度决定后,在一行中进行文本片段的放置。文本片段的 align 决定了文本片段在行中的水平位置: 首先,从左向右连续紧靠放置 align 为 ‘left’ 的文本片段盒。然后,从右向左连续紧靠放置 align 为 ‘right’ 的文本片段盒。最后,剩余的没处理的文本片段盒,紧贴着,在中间剩余的区域中居中放置。关于文字在文本片段盒中的位置: 如果 align 为 ‘center’,则文字在文本片段盒中是居中的。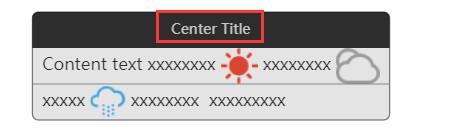 如果 align 为 ‘left’,则文字在文本片段盒中是居左的。
 如果 align 为 ‘right’,则文字在文本片段盒中是居右的。
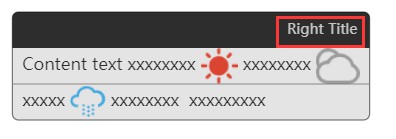
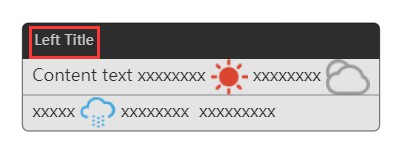
实例效果图: 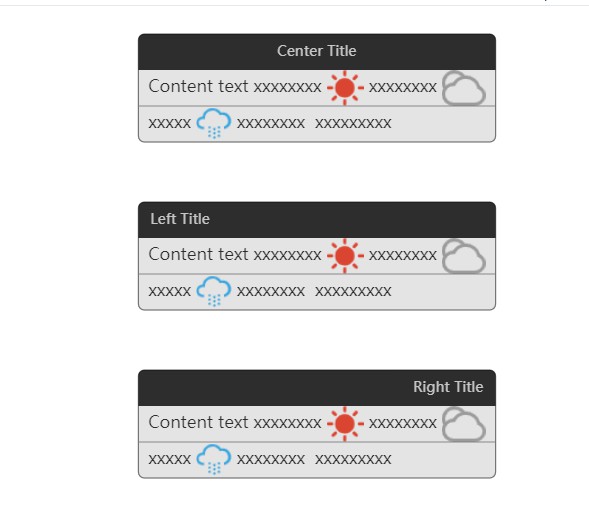
完整代码: ECharts // 基于准备好的dom,初始化echarts实例 var myChart = echarts.init(document.getElementById('main')); // 指定图表的配置项和数据 var weatherIcons = { 'Sunny': 'sunny.png', 'Cloudy': 'cloudy.png', 'Showers': 'raining.png' }; var option = { series: [ { type: 'scatter', data: [ { value: [0,0], label: { normal: { formatter: [ '{tc|Center Title}{titleBg|}', ' Content text xxxxxxxx {sunny|} xxxxxxxx {cloudy|} ', '{hr|}', ' xxxxx {showers|} xxxxxxxx xxxxxxxxx ' ].join('\n'), rich: { titleBg: { align: 'right' } } } } }, { value: [0, 1], label: { normal: { formatter: [ '{titleBg|Left Title}', ' Content text xxxxxxxx {sunny|} xxxxxxxx {cloudy|} ', '{hr|}', ' xxxxx {showers|} xxxxxxxx xxxxxxxxx ' ].join('\n') } } }, { value: [0, 2], label: { normal: { formatter: [ '{titleBg|Right Title}', ' Content text xxxxxxxx {sunny|} xxxxxxxx {cloudy|} ', '{hr|}', ' xxxxx {showers|} xxxxxxxx xxxxxxxxx ' ].join('\n'), rich: { titleBg: { align: 'right' } } } } } ], symbolSize: 1, label: { normal: { show: true, backgroundColor: '#ddd', borderColor: '#555', borderWidth: 1, borderRadius: 5, color: '#000', fontSize: 14, rich: { titleBg: { backgroundColor: '#000', height: 30, borderRadius: [5, 5, 0, 0], padding: [0, 10, 0, 10], width: '100%', color: '#eee' }, tc: { align: 'center', color: '#eee' }, hr: { borderColor: '#777', width: '100%', borderWidth: 0.5, height: 0 }, sunny: { height: 30, align: 'left', backgroundColor: { image: weatherIcons.Sunny } }, cloudy: { height: 30, align: 'left', backgroundColor: { image: weatherIcons.Cloudy } }, showers: { height: 30, align: 'left', backgroundColor: { image: weatherIcons.Showers } } } } } } ], xAxis: { axisLabel: {show: false}, axisLine: {show: false}, splitLine: {show: false}, axisTick: {show: false}, min: -1, max: 1 }, yAxis: { axisLabel: {show: false}, axisLine: {show: false}, splitLine: {show: false}, axisTick: {show: false}, min: 0, max: 2, inverse: true } }; // 使用刚指定的配置项和数据显示图表。 myChart.setOption(option); |
【本文地址】
公司简介
联系我们