|
文章目录
简介2D图形数学图形折线图光滑线散点图柱状图直方图
3D图形数学图形曲面图
小结参考资料
在绘制 2维平面几何图,是不是有人想到了绘制 3维图,包
pgfplots 正好能实现你的需求,他不仅能绘制 3维图,也能绘制 2维图,在接下来的内容中会详细介绍……
本文演示环境的配置,请参考我的另一篇文章《ubuntu20.04下vim+vimtex编写latex的利器》
本文代码大部分来自于网络,在这里汇集,方便检索。
简介
在正式使用 pgfplots 之前,我们先来看下,其绘图环境的格式,如下:
1 \documentclass{article}
2 \usepackage[UTF8]{ctex}
3 \usepackage{pgfplots}
4 \begin{document}
5 \begin{tikzpicture}
6 \begin{axis}
7 %绘图
8 \end{axis}
9 \end{tikzpicture}
10 \end{document}
从如上格式可以看出:
需要引入包:\usepackage{pgfplots}需要把 axis 嵌入到 tikzpicture,因为pdfplots 也是基于 tikz发展出来的。
 上图就是绘图板,以后的图形都是在上面绘制出来的。 上图就是绘图板,以后的图形都是在上面绘制出来的。
不过在学习之前,先让大家体验下视觉感受,别眨眼啊…… 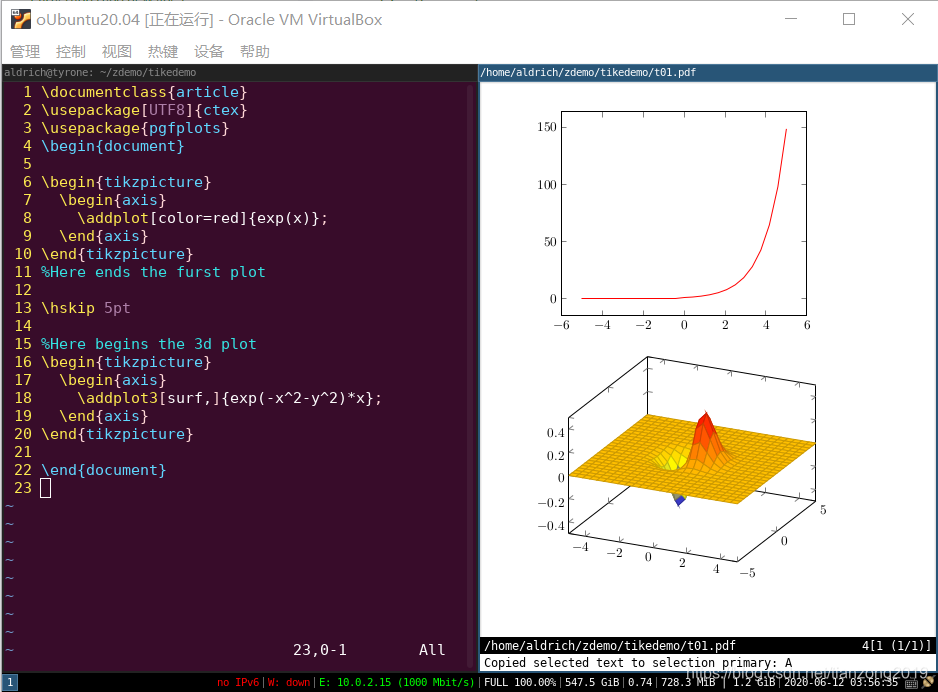
2D图形
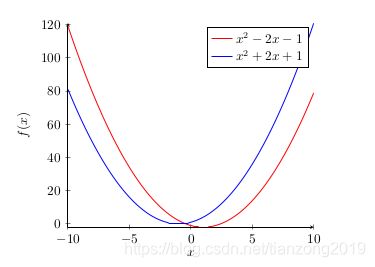
数学图形
本文的演示就直接上图片和代码了,需要注意的地方都有注释,对这种编程风格不熟悉的,请先阅读我的另外了2篇文章:
《Latex-TiKZ绘制数学平面几何图教程》《中文版Latex常用语法大全教程》
1 \documentclass{article}
2 \usepackage[UTF8]{ctex}
3 \usepackage{pgfplots}
4 \begin{document}
5
6 \begin{tikzpicture}
7 \begin{axis}
8 %坐标系配置,只显示左边坐标轴
9 [axis lines = left, xlabel = $x$, ylabel = {$f(x)$}]
10 %绘制曲线-1
11 \addplot [domain = -10:10, samples=100, color=red]{x^2 - 2*x -1};
12 \addlegendentry{$x^2 - 2x - 1$}; %绘制标注
13 %绘制曲线-2
14 \addplot[domain = -10:10, samples=100, color=blue]{x^2 + 2*x + 1};
15 \addlegendentry{$x^2 + 2x + 1$}; %绘制标注
16 \end{axis}
17 \end{tikzpicture}
18
19 \end{document}
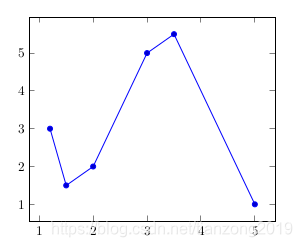
折线图
1 \documentclass{article}
2 \usepackage[UTF8]{ctex}
3 \usepackage{pgfplots}
4 \begin{document}
5 \begin{tikzpicture}
6 \begin{axis}
7 \addplot+[sharp plot] % 设置绘图的类型是折线图
8 coordinates % 声明是在迪卡尔坐标系中的数据
9 { % 输入数据
10 (1.2,3) (1.5,1.5) (2,2)
11 (3,5) (3.5,5.5) (5,1)
12 };
13 \end{axis}
14 \end{tikzpicture}
15
16 \end{document}
17
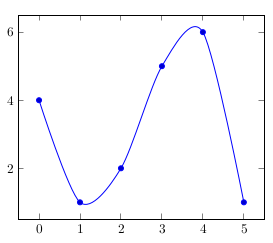
光滑线
1 \documentclass{article}
2 \usepackage[UTF8]{ctex}
3 \usepackage{pgfplots}
4 \begin{document}
5 \begin{tikzpicture}
6 \begin{axis}
7 \addplot+[smooth] % 设置绘图的类型是光滑线图
8 coordinates
9 {
10 (0,4) (1,1) (2,2)
11 (3,5) (4,6) (5,1)
12 };
13 \end{axis}
14 \end{tikzpicture}
15
16 \end{document}
散点图
1 \documentclass{article}
2 \usepackage[UTF8]{ctex}
3 \usepackage{pgfplots}
4 \begin{document}
5 \begin{tikzpicture}
6 \begin{axis}
7 \addplot+[scatter,only marks,mark size=2.9pt]
8 coordinates
9 {
10 (1,4) (1,1) (2,2)
11 (3,5) (4,6) (5,1)
12 };
13
14 \end{axis}
15 \end{tikzpicture}
16
17 \end{document}

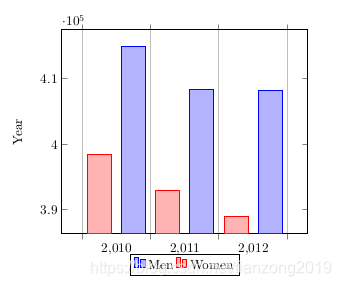
柱状图
1 \documentclass{article}
2 \usepackage[UTF8]{ctex}
3 \usepackage{pgfplots}
4 \begin{document}
5 \begin{tikzpicture}
6 \begin{axis}
7 [
8 ylabel=Year,
9 ybar interval=0.7, %Thickness of each bar.
10 %图注
11 legend style={at={(0.5,-0.1)},anchor=north,legend columns=-1},
12 ]
13 \addplot
14 coordinates {(2012,408184) (2011,408348)
15 (2010,414870) (2009,412156)};
16 \addplot
17 coordinates {(2012,388950) (2011,393007)
18 (2010,398449) (2009,395972)};
19 \legend{Men,Women}
20
21 \end{axis}
22 \end{tikzpicture}
23
24 \end{document}
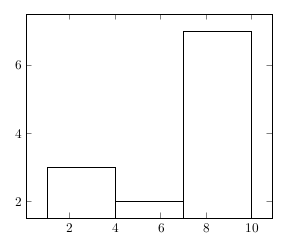
直方图
1 \documentclass{article}
2 \usepackage[UTF8]{ctex}
3 \usepackage{pgfplots}
4 \begin{document}
5 \begin{tikzpicture}
6 \begin{axis}
7 \addplot[hist={bins=3}] % 绘制图像设置为直方图,组距为3
8 table[row sep=\\,y index=0] % 设置表的行以"\\"分隔,y的从0开始
9 {
10 data\\ % 输入数据
11 1\\ 2\\ 1\\ 5\\ 4\\ 10\\
12 7\\ 10\\ 9\\ 8\\ 9\\ 9\\
13 };
14
15 \end{axis}
16 \end{tikzpicture}
17
18 \end{document}
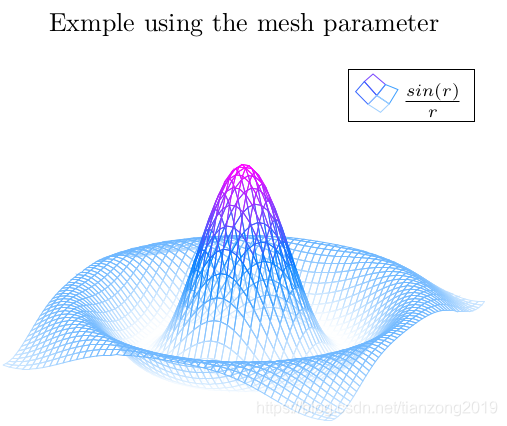
3D图形
数学图形
1 \documentclass{article}
2 \usepackage[UTF8]{ctex}
3 \usepackage{pgfplots}
4 \begin{document}
5 \begin{tikzpicture}
6 \begin{axis}
7 [
8 title=Exmple using the mesh parameter,
9 hide axis,
10 colormap/cool,
11 ]
12 \addplot3[
13 mesh,
14 samples=50,
15 domain=-8:8,
16 ]
17 {sin(deg(sqrt(x^2+y^2)))/sqrt(x^2+y^2)};
18 \addlegendentry{$\frac{sin(r)}{r}$}
19
20 \end{axis}
21 \end{tikzpicture}
22
23 \end{document}
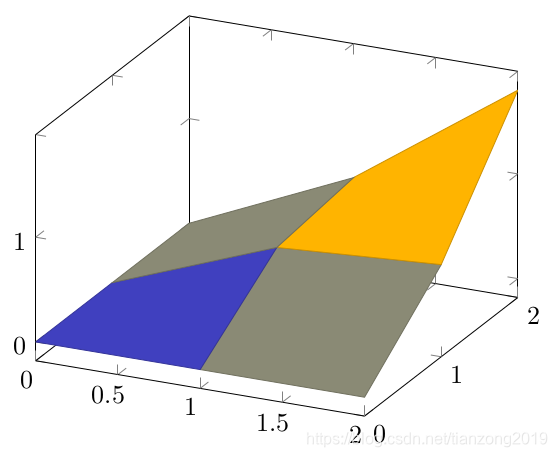
曲面图
1 \documentclass{article}
2 \usepackage[UTF8]{ctex}
3 \usepackage{pgfplots}
4 \begin{document}
5 \begin{tikzpicture}
6 \begin{axis}
7 \addplot3[
8 surf,
9 ]
10 coordinates {
11 (0,0,0) (0,1,0) (0,2,0)
12
13 (1,0,0) (1,1,0.6) (1,2,0.7)
14
15 (2,0,0) (2,1,0.7) (2,2,1.8)
16 };
17
18 \end{axis}
19 \end{tikzpicture}
20
21 \end{document}
小结
本文从网络上检索了一些示例用于演示,总体上
addplot 用于绘制二维图,数学图形和统计图形addplot3 用于绘制三维图根据要绘制的图形类型不同,选择合适的参数即可。
参考资料
https://blog.csdn.net/u010450214/article/details/50601641https://www.overleaf.com/learn/latex/Pgfplots_package
|